Gregor Johann Mendel
390 likes | 909 Vues
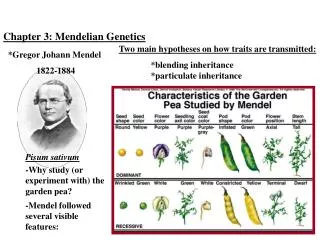
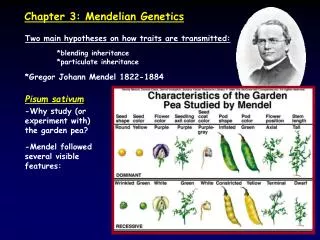
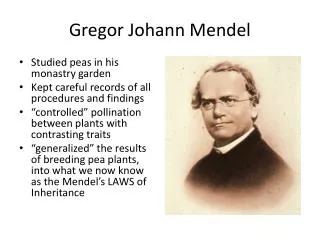
Gregor Johann Mendel. “Father of Genetics”. Mendel’s success. Came up with an elegant model of experimental design chose a good “model” organism: Pisum sativum restricted his examination to one or very few pairs of contrasting traits in each experiment

Gregor Johann Mendel
E N D
Presentation Transcript
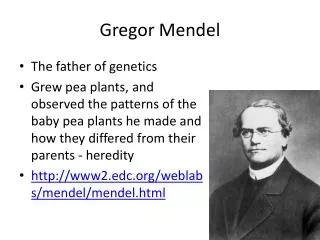
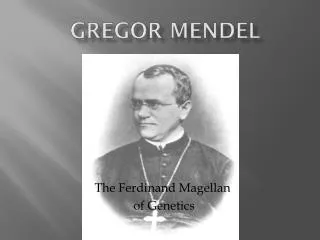
Gregor Johann Mendel “Father of Genetics”
Mendel’s success • Came up with an elegant model of experimental design • chose a good “model” organism: Pisum sativum • restricted his examination to one or very few pairs of contrasting traits in each experiment • took meticulous notes with accurate quantitative records
Empirical approach • Mendel did not have a hypothesis that he was testing (hypothetico-deductive method)… instead his experiments were designed to determine the quantitative relationships from which laws could be discovered
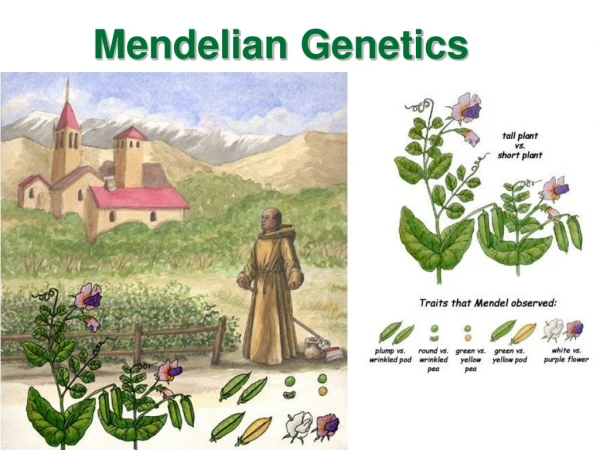
Seven pairs of contrasting characteristics of the garden pea -seed coat, seed color, petal color, pod shape, pod color, stem size, axial/terminal flowers.
Monohybrid cross • Hybridization = when two plants of the same species but with different characteristics are crossed (mated) to each other. • Mono = dealing with one pair of contrasting characteristics
Mendel’s explanation 1) the existence of “factors” – particulate theory of inheritance 2) genes are in pairs 3) the principle of segregation 4) gametic content 5) random fertilization
Mendel’s First Law • Equal Segregation = The two members of a gene pair segregate from each other into the gametes; so half the gametes carry one member of the pair and the other half of the gametes carry the other member of the pair.
Punnent Squares & The branch diagram method • Used to visualize the genotypes and phenotypes resulting from the recombination of gametes during fertilization
Dihybrid Cross • Follows the inheritance of two different traits within the same individual. • i.e. Yellow, Round x Green, Wrinkled
Mendel’s Second Law • Independent Assortment = two different genets will randomly assort their alleles during gamete formation
4 possible male gametes 4 possible female gametes
The testcross • Crossing an individual of “unknown” genotype with a fully recessive homozygote.
Hypothesis Testing • To determine if the data from genetic crosses are consistent with a particular pattern of inheritance • We can distinguish between inheritance patterns that obey Mendel’s laws and those that do not… • Can quantitatively analyze the offspring – testing provides an objective, statistical method to evaluate whether or not the observed data really agree with the hypothesis. • Evaluate the “Goodness of Fit”
Hypothesis testing • Falsification is the basis for hypothesis testing • A statement about population characteristics through their corresponding parameters, such as the population mean µ, or the population proportion p. • 1) make an initial assumption • 2) collect data • 3) based upon the evidence, conclude whether or not your initial assumption is supported
If an event can easily occur, we attribute it to chance, but if the event appears to be unusual, we conclude that the significant departure makes it unlikely that our initial null hypothesis is true We reject the null hypothesis when the computed statistic falls in the tail areas
p value or critical value • The random sample with the proper transformation known as test statistic will provide the evidence from the data in terms of a p-value, to either reject or not to reject the null hypothesis H0. • p-values are measures of how well the evidence from the data support the null hypothesis. Therefore, large p-values mean the null hypothesis should not be rejected, and small p-values mean the null hypothesis should be rejected.
Chi Square Test • Parametric test that can be used to analyze population data in which the members of the population fall into different categories. • If we draw all possible samples of size n from a normal population and plotted, they would form the χ2 distribution • The χ2 test is used to compare the shape of our data distribution to a distribution of known shape [goodness of fit] • Good for genetics, because crosses usually produce a population of offspring that differ with regard to phenotypes.
Degrees of Freedom • Degrees of Freedom: measure of the number of categories that are independent of each other. [typically n – 1, where n = the total # of categories] • Allows us to choose the appropriate distribution for the data
For example, does 787 tall to 277 short really indicate a 3:1 ratio? tall short observed # 787 277 expected ratio 3/4 1/4 expected # (787 + 277)3/4 = 798 (787 + 277)1/4 = 266 (O - E) -11 +11 (O - E)2 121 121 (O - E)2/E 0.15 0.45 • X2 = 0.15 + 0.45 = 0.60
A true-breeding cut leaf, green stem (CC pp) tomato is crossed with a true-breeding potato leaf, purple stem (cc PP) tomato plant. F1 is all cut and purple tomato plants. • F1 xF1 progeny: • X2 = 0.15 + 0.45 = 0.60
A true-breeding cut leaf, green stem (CC pp) tomato is crossed with a true-breeding potato leaf, purple stem (cc PP) tomato plant. F1 is all cut and purple tomato plants. • F1 xF1 progeny: • X2 = 4.72, df = 4-1 = 3
Restrictions of χ2 • O and E values must be actual counts, ie2can only be used with absolutefrequencies; the test is not valid if data are converted to relative frequencies or %. • Categories must be independent and complete, ie a 2 test must be carried out on the whole sample at once, not on subsets of it at a time