Download
1 / 20
200 likes | 329 Vues
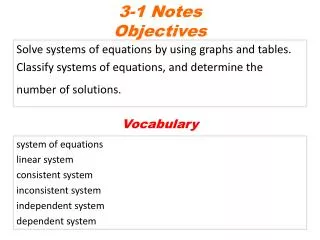
Linking graphs and systems of equations. Graph of a linear equation Graphical solutions to systems. Linking graphs and systems of equations. Today, we introduce the concept of a graph to find a solution to a system of equations As for last week we will examine systems of 2 equations/unknowns

E N D
Linking graphs and systems of equations Graph of a linear equation Graphical solutions to systems
Linking graphs and systems of equations • Today, we introduce the concept of a graph to find a solution to a system of equations • As for last week we will examine systems of 2 equations/unknowns • This gives us another way of solving systems of equations • Often useful in economics (and for checking results to your calculations) • However, it also allows us to understand better identification problems
Linking graphs and systems of equations Graph of a linear equation Solving a system of 2 equations graphically Graphs, systems and identification
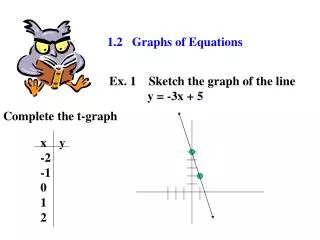
Graph of a linear equation • The general notation for a linear equation is given by: • Where (x,y) are unknowns and (a,b) are parameters. • Lets imagine that a = 0.5 and b = 5 • What is the graph of the function
Graph of a linear equation Vertical axis ‘y’ axis Horizontal axis ‘x’ axis Going back to week 4, we first need some axes
Graph of a linear equation y x • This allows us to graph the function • x→ y=0.5x + 5
Graph of a linear equation • In order to do so, we need to know the values that the function takes for all x’s. • This is done with the ‘variation table’ • For a linear function you only need 2 points • The x=0 point often provides an easy start • For non-linear functions, this is not the case!
Graph of a linear equation y x Plotting the data from the variation table allows you to obtain the graph of the function:
Linking graphs and systems of equations Graph of a linear equation Solving a system of 2 equations graphically Graphs, systems and identification
Solving a system of equations graphically • We will base this analysis on the supply and demand example we saw last week: • We already have the solution for P and Q, which we worked out analytically. • The system solves for P = 400 and Q = 800. • We will now solve the system graphically to show that the solution point is the same.
Solving a system of equations graphically P Q • Step 1: modify the system to express the equations as functions in your graphical space • In economics, price is on the vertical axis, quantity on the horizontal one
Solving a system of equations graphically • Step 1 (cont’d) : The system becomes • Step 2 : Draw each function in the available space
Solving a system of equations graphically P 1200 1000 800 600 400 200 Q 200 400 600 800 1000 1600 • Step 3 : The solution is given by the coordinates of the intersection of the 2 functions • P = 400 and Q = 800 !
Linking graphs and systems of equations Graph of a linear equation Solving a system of 2 equations graphically Graphs, systems and identification
Graphs, systems and identification The graph of a system of equations allows us to find the solutions to a system of 2 equations and 2 unknowns, but it also allows us to understand why certain systems don’t have solutions Example : one of the systems you had as an exercise… Why can’t it be solved ?
Graphs, systems and identification Rearranging the system expressing y as a function of x: Let’s see what the graph of this system looks like…
Graphs, systems and identification y 2.4 2.2 2 1.8 1.6 1.4 1.2 x 1 2 3 4 5 • The functions are parallel, no intersection exists • They are said to be “co-linear”
Graphs, systems and identification • This is similar to having twice the same equation ! • This means that for a system to have a solution, you need 2 independent (different) equations • If they are co-linear, no solution exists because you have twice the same information… • What about this second case :
Graphs, systems and identification y 12 10 8 6 4 2 x 2 4 6 16 18 12 8 10 14 • This time there are too many solutions !! • Again, there is no defined “single” solution…
Graphs, systems and identification • The graphical approach clarifies why you need exactly N equation for N unknowns: • The system is “under-indentified”: • If the number of equations is smaller than the number of variables • Or if some equations are co-linear • The system is “over-indentified”: • If there are more equations than unknowns • The system is “just-indentified”: • If the number of (independent) equations is equal to the number of unknowns