Real-Time Visualization Tools: Enhancing Business Decision-Making with Digital Dashboards
Digital dashboards are essential tools for visualizing key business indicators in real-time. This presentation by Randheer Edachery explores their importance in management information systems, enabling effective decision-making. Learn how these tools evolved from the 1970s at MIT to today's web-based solutions, and discover their main types, including stand-alone applications and browser-based add-ons. The benefits of digital dashboards, such as performance visualization, trend identification, and efficient reporting, highlight their role in improving organizational performance.

Real-Time Visualization Tools: Enhancing Business Decision-Making with Digital Dashboards
E N D
Presentation Transcript
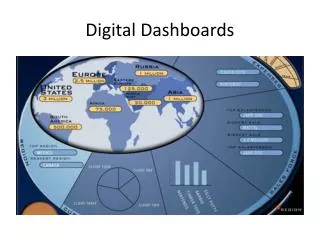
DIGITAL DASHBOARDS CCT355 Presentation by RandheerEdachery
WHAT ? • Real Time Visualisation Tools of Critical Business Indicators • Important for decision making
WHAT ? • Process that falls under the category of Management Information Systems
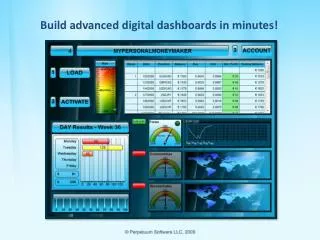
HOW ? • A set of Information Charts (or data visualisation) in a well-known format (bar charts, pie charts, etc) that give information about the evolution of selected ratios in (approximately) real time.
WHY ? • Instantly see how the business is evolving • Helps narrow down areas which require immediate action
HISTORY OF DIGITAL DASHBOARDS • Initially conceived by MIT researchers - 1970's • Internet Boom of the 90's facilitates the spread of Digital Dashboards
HISTORY OF DIGITAL DASHBOARDS • Researchers concerned themselves primarily with Interactive Computer Systems that could aid Management in effective Decision Making
TYPES OF DIGITAL DASHBOARDS • 3 Main Categories of Dashboards
STAND-ALONE APPLICATIONS • Interface with existing programs for Data Compilation and Display
WEB-BASED SOLUTIONS • Pulls data from company servers or user hard drives • Can be accessed remotely
SKINS • Browser add-ons that operate within the browser and compile data from a linked network or user-accessed cloud applications
BENEFITS OF DIGITAL DASHBOARDS • Visual Presentation of Performance Measures • Ability to generate detailed reports showing New Trends
BENEFITS OF DIGITAL DASHBOARDS • Ability to Identify and Correct Negative Trends • Measure Efficiencies / Inefficiencies
DESIGN PRINCIPLES • Ease of Use - Ensure that Design isn't too Complex or Elementary. • Allow for plenty of "white space” • Color – Shading - Graphics : vital aspects of dashboard efficiency
Questions and thoughts ? • FYI : Interesting to note that Digital Dashboards are structured to mimic the dashboards that you see in cars ! • Also, the reason why the primary colors of Digital Dashboards are red, yellow and green - indicative of traffic signs !