Download
1 / 6
60 likes | 168 Vues
This overview highlights the evolution of the DELC education dashboards, tracing their development from version 1.0 (2006-2008) to version 3.0 (2012-present). Key advancements include enhanced report export capabilities, additional assessment data sources, and improved metrics for tracking "at-risk" students. Users can create custom data views with drag-and-drop features, schedule reports for email delivery, and access comprehensive metrics related to college and career readiness. The emphasis on data-driven decision-making fosters discussions around priorities and transparency in educational settings.

E N D
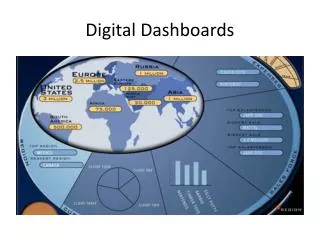
Education Dashboards DELC October 5, 2011
Dashboard 1.0(2006 – 2008) DELC October 5, 2011
Dashboard 2.0(2008 – 2011) • Additional assessment data sources • Focus on report export capability • Increased sophistication around report requests • “At-Risk” metrics DELC October 5, 2011
Dashboard 3.0(2012 - ) • Allow users to build custom views of data with drag and drop queries • Reports to be scheduled and delivered to organizational email address • College and Career Ready metrics • Additional data sources (HR, Financial, Assessments) DELC October 5, 2011
Classroom • Supports differentiation • School • Aggregated and disaggregated information for school reporting and student interventions • Efficiency gains with diploma and course reporting • Start with VP’s and counselors • Organizational • Organization begins to ask complex questions • Forces discussion around language and priorities • Sophisticated reports for multiple stakeholder groups Value-add DELC October 5, 2011
Training critical • Application & use of data • Language • Do we all understand our terms? • Priorities • What will we measure and why? • Transparency • I don’t like what the numbers say and they make me uncomfortable! Issues DELC October 5, 2011