Download
1 / 1
10 likes | 199 Vues
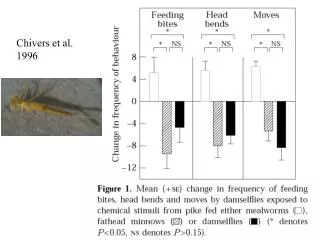
The quantification of semiquinone-type free radicals (SFRC, Fig. 6), from EPR, and the values of I 465 (a huminification index) from fluorescence (Fig. 6) measurements (Milori et al., 2002) indicated the extents of humification in

E N D
The quantification of semiquinone-type free radicals (SFRC, Fig. 6), from EPR, and the values of I465 (a huminification index) from fluorescence (Fig. 6) measurements (Milori et al., 2002) indicated the extents of humification in the samples from the incubation and the control soils. Note the similar trends for the SFRC and I465 data for the HAs from the control soil (where humification had reached an equilibrium). The SFRC/I465 relationship is less in line for the HAs from the incubation soil. That is because the humification process is active, and phenols (from lignin) are oxidized to quinones by a free radical mechanism. Thus the free radical content is relatively higher than the fluorescence index of humification. Note the lesser (than for the HAs) radicals content in the control soil FA, yet the significant fluorescene. When humification is complete,free radicals (and –O-aromatic substituents) are less, and fluorescence is greater. We await NMR evidence to explain the lesser radicals and fluorescence in the case of the FAs from the incubated soil. Introduction were similar to those obtained at pH 12.6 when urea was not used Table 1 Sugar contents of humic, fulvic, and XAD-4 acids isolated in NaOH solutions media The mass ratios [(mannose + galactose)/(xylose + arabinose), and (rhamnose + fucose)/ (xylose + arabinose)] indicated that isolates at pH 12.6, and in the presence of urea were mainly derived from plant material, and represented contributions from the transforming maize. Fig. 2 Mass ratios of (mannose + galactose)/( arbinose + xylose) and(rhamnose + fucose)/( arabinose + xylose) for Oak park incubation soil at different pH ISOLATION, FRACTIONATION, AND CHARACTERIZATION OF HUMIC SUBSTANCES FROM A MAIZE-AMENDED SOILGuixue Song, Michael M.B.HayesChemical & Environmental Sciences Department, University of Limerick, Ireland Email: guixue.song@ul.ie, michael.h.hayes@ul.ie A study by Hayes et al (1996), using NMR, has shown that there aresignificant compositional differences between the humic fractions isolated at different pH values using aqueous sodium hydroxide (0.1 M) at pH 7.5, 10.6 and 12.6. The mechanisms of dissolution of HS in different solvent systems was reviewed by Hayes and Graham (2000). The use of urea, a powerful hydrogen bond reaker, has beenavoided because of the danger of introducing N into the humic isolates. However, that is unjustified as it is unlikely that urea will form covalent links with HS. In the present study maize (Zea mays L), a C4 plant was incubated with a long term cultivation. After one year of incubation,samples were extracted at different pH values, and after exhaustive extraction in base, a base + urea solution was used. The material isolated in this latter medium falls under the definition of humin. Aspects of the compositions of the fractions isolated are studied and in some instances are compared with similar fractions from the non-amended soil. After the exhaustive extractions described above, a further exhaustive extraction was carried out using 6 M urea in 0.1 M NaOH (pH 12.6). The extract was processed as above. Materials and Methods Fig.3 shows the range (158.6 nmol/mg to 766.5 nmol/mg) of amino acids (AA) detected. The lowest contents of AAs were in the FAs, hehighestcontents were generally in the HAs. This also applied for the unamended soil.AAs from urea extracts were similar to those from pH 12.6. Fig.4 Relative molar percentages and total concentration of total Amino acids content *Acidic: Asp, Glu; Basic: Arg, Lys, His; Neutral hydrophilic: Val, Phe, Iieu, Leu, Met, Ala ; Neutral hydrophobic: Ser, Gly, Thr, Tyr. Fig.4 shows the range (158.6 nmol/mg to 766.5 nmol/mg) of amino acids (AA) detected. The lowest contents of AAs were in the FAs, the highest contents were generally in the HAs. This also applied for the unamended soil. AAs from urea extracts were similar to those from pH 12.6. Humic acids (HAs) were extracted from a long term cultivated soil, cropped with wheat (Triticum aestivum, L) each year for 30 y at the Oak Park Teagasc Experimental Station, Carlow, Ireland. The soil had been incubated for one year in the laboratory with 8% (w/w) C4 maize (Zea mays L), fertilized with NPK (10-10-20), and was stirred and watered regularly. The total carbon (C) content of the maize amended soil is 5.6%. Soils were H+-exchanged and extracted by rolling for at least 2 h in 0.1 M NaOH solution adjusted to pH 7.5. The sediment was re-extracted as before, and the process was repeated until the supernatant had negligible color. Supernatants were filtered (0.2 m membrane). The sediment was then exhaustively extracted with 0.1 M NaOH adjusted to pH 10.6, and then (exhaustively) with 0.1 M sodium hydroxide at pH 12.6. After centrifugation the supernatant solutions were adjusted to pH 7.0 using 6 M HCl, and filtered (0.2 m membrane). The pH of the filtrate was adjusted to 1.0 (6 M HCl). Precipitation of HAs took place overnight at 4 oC and then the HA and fulvic acid (FA) fractions were separated by centrifugation. The HA precipitates were dialyzed against distilled water until chloride free, and then freeze-dried. The FA solution was passed slowly through XAD-8 and XAD4 resin in tandem in 0.01 M HCl. Distilled water was passed through the column till the conductivity was <100 μS cm-1. Then the column was back eluted with 0.1 M NaOH, and the eluate was passed through IR-120 (H+-form), and then freeze dried. Fig 7. SFRC of EPR of HAs and FAs from the control (a) and incubation (b) soils Fig4.Values of I465 (emission 517nm) of HAs and FAs from the control (a) and ncubation (b)soils The values of 13C for the HAs from the incubation soil ranged from –17.97 to -20.19‰; those for the unamended soil were ca –28‰ (indicating origins in C3 plants). The maize has a 13C value of ca – 12‰. The smaller the numerical negative value the greater the 13C enrichment, and the greater the contribution from the maize. Thus, as expecte d, maize contributed more to the less humified fractions (pH 10.6 and 12.6 extracts). The more highly oxidized FAs had a greater contribution (than the HAs) from the indigenous SOM. Table 4 13C data for the HAs and FAs from the amended and unamended Oak Park soil Results and Discussion The data in Fig 1 indicate that the bulk of the HAs were isolated in the NaOH at pH 7.5 and at pH 12.6, and the lowest yields of HAs, FAs and XAD-4 were isolated at pH 10.6. After exhaustive extraction with NaOH, significant amounts of HAs and FAs, and especially XAD-4 acids were extracted with 6 M urea and 0.1 M NaOH at pH 12.6. In the classical definitions such extracts would be considered to be from the humin fraction. The introduction of urea to the aqueous extraction system increased by 24.4% the total amounts of HS isolated, and this included increases of 23.1%, 25%, and 38.8% in the yields of the HA, FA, and XAD-4 acids, respectively. It is concluded that the urea helped release these fractions from their associations in the ‘humin’ matrix. Fig.1 Yields of HAs, FAs and XAD-4s The percentages of neutral sugars in the HS (detected by GC as the alditol acetate derivatives of reduced glucose, galactose, mannose, fucose, rhamnose, xylose, arabinose and ribose released on hydrolysis) ranged from 4.2 to 22.3 nmol mg-1 (Table 1) The XAD-4 acids, as expected were most enriched in sugars, but unusually, and in contrast to the data (not included) for the non-amended soil, the FAs were more enriched in sugars than the HAs. The sugar contents of the ‘urea’ fractions A Conclusion The data have shown that maize added to the soil one year prior to sampling is still undergoing humification. Because of space limitations it has not been possible to make comprehensive comparisons of data for amended and unamended soils, but it is clear from the FTIR spectra that the compositions of the humic fractions from the two soils are different. The humic fractions from the amended soil have signals that can be traced to the amending maize, and observations from free radical contents and from fluorescence data indicate how, when humification has matured, fluorescence is increased and free radicals decrease. The data show that there are distinct compositional differences in humic fractions isolated on the basis of charge density differences, and they highlight the benefits of using simple labels, such as corn, in humification studies B Fig. 5. (A) FTIR spectra of HAs from incubation soil (B) FTIR spectra of HAs from control soil The FTIR spectra (Figs 1 and 2) of the samples from the amended soil show far greater resolution in the fingerprint region than those for the non-amended soil. The spectra for the urea extracts are similar to the others for the amended soil. It can be assumed that the better resolution in the 1500 cm-1 to –1000 cm-1 range is attributable to plant signals in incompletely humified maize.