Download
1 / 9
90 likes | 273 Vues
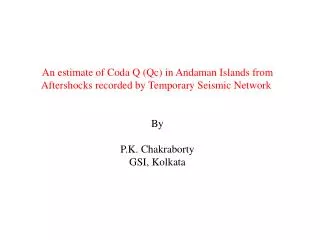
An estimate of Coda Q (Qc) in Andaman Islands from Aftershocks recorded by Temporary Seismic Network By P.K. Chakraborty GSI, Kolkata. O.T,. Station : Diglipur (DGP), Origin time: 2002 10 01 0403 46.11, Mag:3.5. Single backscattering model of Aki and Chouet (1975)

E N D
An estimate of Coda Q (Qc) in Andaman Islands from Aftershocks recorded by Temporary Seismic Network By P.K. Chakraborty GSI, Kolkata
O.T, Station : Diglipur (DGP), Origin time: 2002 10 01 0403 46.11, Mag:3.5
Single backscattering model of Aki and Chouet (1975) A(f,t) = C(f) t –a exp (-ft/Qc) -------(1) ln[A(f,t).t] = c-bt ---------(2) Where b = ft/Qc and c= ln C(f)
1: Original trace, 2-7: Bandpass filtered waveforms of the event recorded at DGP on 01-10-2002 at 04 03 46..11. Bandpass: 1-2, 2-4, 4-8, 6-12, 8-16 and 12-24 Hz.
Lapse time window : 30 Sec Q=325, f=6 Q=69 f=1.5 Q=805, f=12 ln (A,t) Q=1204, f=18 Q=157, f=3 Q=676, f=9 ln (A,t) Coda Q values at different central frequencies for the Event: 2002 10 01 0403 46.11 recorded at DGP
Epicentral map along with the seismic Network. Recording Stations are shown as triangles and epicentres are Depicted as solid circles. DGP MAB HVK POR
Lapse time window: 20 Sec 30 Sec 40 Sec Qc = 108 f 0.99 Qc= 62 f 1.1 Qc = 21 f 1.12 Qc Frequency dependence Qc relation for different Lapse time window in Andaman.