Download
1 / 55
550 likes | 689 Vues
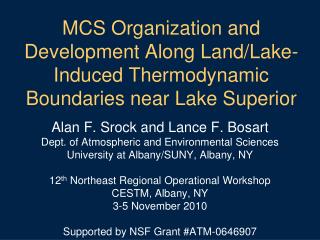
Multiscale Analyses of Tropical Cyclone-Midlatitude Jet Interactions: Camille (1969) and Danny (1997). Matthew S. Potter, Lance F. Bosart, and Daniel Keyser Department of Atmospheric and Environmental Sciences University at Albany, SUNY, Albany, NY.

E N D
Multiscale Analyses of Tropical Cyclone-Midlatitude Jet Interactions: Camille (1969) and Danny (1997) Matthew S. Potter, Lance F. Bosart, and Daniel Keyser Department of Atmospheric and Environmental Sciences University at Albany, SUNY, Albany, NY 37th Annual Northeastern Storm Conference Saturday 3 March 2012 Support Provided By UCAR/NCEP Grant S1071092
Presentation Outline • Motivation and Objectives • Data and Methodology • TC Camille (1969) Multiscale Analysis • TC Danny (1997) Multiscale Analysis • Concluding Remarks
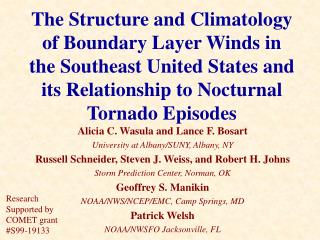
Motivation • Interactions between over land tropical cyclones and midlatitude jets are not fully understood • Severe inland flooding associated with TC Camille has not been given as much attention as other events: • Agnes (1972) • Fran (1996) • Floyd (1999) • Documentation of an inland reintensifying TC, such as TC Danny, is scarce
Objectives • Document the synoptic background and underlying mesoscale processes that led to: • the inland flooding associated with TC Camille • the inland reintensification of TC Danny • Compare and contrast the two events
Data and Methodology • Maps and cross sections were constructed using reanalysis datasets: • 1.125° ERA-40 (TC Camille) • 0.5° Climate Forecast System Reanalysis (CFSR) (TC Danny)
Data and Methodology • Radar data • Hourly radar summary charts are used in the Camille case study to track the evolution of the precipitation over west-central Virginia • WSR-88D radar datasets are used to identify structural changes in the convective and stratiform precipitation as Danny reintensified • A potential vorticity (PV) perspective is used to interpret the multiscale analyses
TC Camille (1969) Overview 690 mm (27 in) of rain fell over West Central Nelson County Severe Inland Flooding (153 fatalities) 0000 UTC 20 August 1005 hPa 25 kt 0000 UTC 18 August 909 hPa 165 kt 0000 UTC Locations The Roanoke Times
TC Camille (1969) Overview 250-hPa wind speed (shaded, m s-1), 1000–500-hPa thickness (dashed red, dam), and MSLP (solid black, hPa)
TC Camille (1969) Overview 250-hPa wind speed (shaded, m s-1), 1000–500-hPa thickness (dashed red, dam), and MSLP (solid black, hPa)
TC Camille (1969) Overview 250-hPa wind speed (shaded, m s-1), 1000–500-hPa thickness (dashed red, dam), and MSLP (solid black, hPa)
TC Camille (1969) Overview 250-hPa wind speed (shaded, m s-1), 1000–500-hPa thickness (dashed red, dam), and MSLP (solid black, hPa)
TC Camille (1969) Overview 250-hPa wind speed (shaded, m s-1), 1000–500-hPa thickness (dashed red, dam), and MSLP (solid black, hPa)
TC Camille (1969) Overview 250-hPa wind speed (shaded, m s-1), 1000–500-hPa thickness (dashed red, dam), and MSLP (solid black, hPa)
Moisture Transport Precipitable water (mm), 700-hPa Omega (light blue contour every -2 × 10⁻³ hPa s-1), 925-hPa heights (contoured in black), θ (dashed red every 2 K), and winds (barbs, kt) Southerly winds
Moisture Transport Precipitable water (mm), 700-hPa Omega (light blue contour every -2 × 10⁻³ hPa s-1), 925-hPa heights (contoured in black), θ (dashed red every 2 K), and winds (barbs, kt) Baroclinic zone
Moisture Transport Precipitable water (mm), 700-hPa Omega (light blue contour every -2 × 10⁻³ hPa s-1), 925-hPa heights (contoured in black), θ (dashed red every 2 K), and winds (barbs, kt) Nearly 60 mm of PW
Moisture Transport Precipitable water (mm), 700-hPa Omega (light blue contour every -2 × 10⁻³ hPa s-1), 925-hPa heights (contoured in black), θ (dashed red every 2 K), and winds (barbs, kt) Upward vertical motion
Moisture Transport Precipitable water (mm), 700-hPa Omega (light blue contour every -2 × 10⁻³ hPa s-1), 925-hPa heights (contoured in black), θ (dashed red every 2 K), and winds (barbs, kt) Southerly winds Baroclinic zone Nearly 60 mm of PW Upward vertical motion
Moisture Transport Precipitable water (mm), 700-hPa Omega (light blue contour every -2 × 10⁻³ hPa s-1), 925-hPa heights (contoured in black), θ (dashed red every 2 K), and winds (barbs, kt) Favorable conditions for inland flooding
Radar Summary Charts 0445 UTC 20 August 2345 UTC 19 August 2345 UTC 19 August 2345 UTC 19 August 40° 40° TRW TRW+ TRW TRW TRW+ RW- 40,000 ft echo tops TRW TRW TRW 35° 35° 80° 75° 80° 75° Adapted from NCDC (National Climatic Data Center) radar summary charts • Scattered thunderstorms associated with the frontal boundary started to affect northern Virginia around 0000 UTC 20 August • Thunderstorms became more numerous around 0600 UTC 20 August as TC Camille entered the region
Radar Summary Charts 0945 UTC 20 August 2345 UTC 19 August • Thunderstorms moved east of west-central Virginia around 1000 UTC 20 August 40° RW- TRW+ 35° RW 80° 75° Adapted from NCDC (National Climatic Data Center) radar summary charts
Ageostrophic Circulation and Frontogenesis Frontogenesis (shaded in K (100 km)-1 (3 h)-1), θ (solid black every 5 K), ω (dotted red every -2 × 10⁻³ hPa s-1, negative values only), winds normal to the cross section (m s-1)and the ageostrophic wind component tangential to the cross section (m s-1) Divergent ageostrophic winds Upper-level jet Approximate location of hardest hit area 5 cm/s
Ageostrophic Circulation and Frontogenesis Frontogenesis (shaded in K (100 km)-1 (3 h)-1), θ (solid black every 5 K), ω (dotted red every -2 × 10⁻³ hPa s-1, negative values only), winds normal to the cross section (m s-1)and the ageostrophic wind component tangential to the cross section (m s-1) Lower-tropospheric frontogenesis 5 cm/s
Ageostrophic Circulation and Frontogenesis Frontogenesis (shaded in K (100 km)-1 (3 h)-1), θ (solid black every 5 K), ω (dotted red every -2 × 10⁻³ hPa s-1, negative values only), winds normal to the cross section (m s-1)and the ageostrophic wind component tangential to the cross section (m s-1) Tropospheric-deep ascent 5 cm/s
Camille Remarks • The severe inland flooding associated with TC Camille can be attributed to: (1) Tropospheric-deep ascent beneath the equatorward entrance region of a downstream 45 m s−1upper- level jet (2) Moist, lower-level southerly flow that ascended over the lower-tropospheric baroclinic zone (3) Frontogenesis and mesoscale ascent associated with the surface and lower-tropospheric baroclinic zone (4) Heavy upslope precipitation in the mountains
TC Danny (1997) Overview Track where TC Danny reintensified inland 960 mm of rain fell over Dauphin Island 1800 UTC 24 July 1000 hPa 40 kt 0000 UTC 24 July 1012 hPa 20 kt 0000 UTC Locations 0000 UTC 19 July 984 hPa 70 kt
TC Danny (1997) Overview 250-hPa wind speed (shaded, m s-1), 1000–500-hPa thickness (dashed red, dam), and MSLP (solid black, hPa)
TC Danny (1997) Overview 250-hPa wind speed (shaded, m s-1), 1000–500-hPa thickness (dashed red, dam), and MSLP (solid black, hPa)
TC Danny (1997) Overview 250-hPa wind speed (shaded, m s-1), 1000–500-hPa thickness (dashed red, dam), and MSLP (solid black, hPa)
TC Danny (1997) Overview 250-hPa wind speed (shaded, m s-1), 1000–500-hPa thickness (dashed red, dam), and MSLP (solid black, hPa)
TC Danny (1997) Overview 250-hPa wind speed (shaded, m s-1), 1000–500-hPa thickness (dashed red, dam), and MSLP (solid black, hPa)
TC Danny (1997) Overview 250-hPa wind speed (shaded, m s-1), 1000–500-hPa thickness (dashed red, dam), and MSLP (solid black, hPa)
TC Danny (1997) Overview 250-hPa wind speed (shaded, m s-1), 1000–500-hPa thickness (dashed red, dam), and MSLP (solid black, hPa)
TC Danny (1997) Overview 250-hPa wind speed (shaded, m s-1), 1000–500-hPa thickness (dashed red, dam), and MSLP (solid black, hPa)
Cross Section and Dynamic Tropopause Map PV (shaded every 1 PVU), θ (solid black, every 5 K), and the wind component normal to the cross section (dotted green every 5 m s-1) • Potential temperature (shaded every 5 K), 850–200-hPa shear (barbs in kt), and 925–850-hPa layer-averaged relative vorticity (solid black every 1.0 × 10⁻⁴ s-1) Relatively Low Shear Environment
Cross Section and Dynamic Tropopause Map Strengthening PV Tower PV (shaded every 1 PVU), θ (solid black, every 5 K), and the wind component normal to the cross section (dotted green every 5 m s-1) • Potential temperature (shaded every 5 K), 850–200-hPa shear (barbs in kt), and 925–850-hPa layer-averaged relative vorticity (solid black every 1.0 × 10⁻⁴ s-1)
Cross Section and Dynamic Tropopause Map Strengthening PV Tower PV (shaded every 1 PVU), θ (solid black, every 5 K), and the wind component normal to the cross section (dotted green every 5 m s-1) • Potential temperature (shaded every 5 K), 850–200-hPa shear (barbs in kt), and 925–850-hPa layer-averaged relative vorticity (solid black every 1.0 × 10⁻⁴ s-1) Amplifying PV Trough
Cross Section and Dynamic Tropopause Map PV (shaded every 1 PVU), θ (solid black, every 5 K), and the wind component normal to the cross section (dotted green every 5 m s-1) Strengthening PV Tower • Potential temperature (shaded every 5 K), 850–200-hPa shear (barbs in kt), and 925–850-hPa layer-averaged relative vorticity (solid black every 1.0 × 10⁻⁴ s-1) Amplifying PV Trough Increase in lower-tropospheric vorticity
Cross Section and Dynamic Tropopause Map PV (shaded every 1 PVU), θ (solid black, every 5 K), and the wind component normal to the cross section (dotted green every 5 m s-1) Strengthening PV Tower • Potential temperature (shaded every 5 K), 850–200-hPa shear (barbs in kt), and 925–850-hPa layer-averaged relative vorticity (solid black every 1.0 × 10⁻⁴ s-1) Amplifying PV Trough Increase in lower-tropospheric vorticity
Radar and Satellite Imagery GOES-8 Visible Image 2315 UTC 22 July KBMX Base Reflectivity 0013 UTC 23 July
Radar and Satellite Imagery KFFC Base Reflectivity 1218 UTC 23 July GOES-8 Visible Image 1215 UTC 23 July
Radar and Satellite Imagery GOES-8 Visible Image 2315 UTC 23 July KGSP Base Reflectivity 0015 UTC 24 July
Radar and Satellite Imagery GOES-8 Visible Image 1313 UTC 24 July KAKQ Base Reflectivity 1318 UTC 24 July
Radar and Satellite Imagery GOES-8 Visible Image 1815 UTC 24 July KAKQ Base Reflectivity 1814 UTC 24 July
Role of Diabatic Heating • Convection concentrated around TC Danny led to an increase of diabatic heating at mid-levels • PV production at low-levels, suggested by the plot, contributed to TC Danny’s inland reintensification Valid at:
Role of Diabatic Heating (0600 UTC 24 July) 250-hPa wind speed (color shading in kt), 250-hPa potential vorticity (solid gray every 1 PVU), 250-hPa relative humidity (gray shading in %), 600–400-hPa layer-averaged ω (red every 5 × 10⁻³ hPa s-1, negative values only), 300–200-hPa layer-averaged irrotational wind (arrows, m s-1) Diabatic outflow from convection around TC Danny strengthens jet
Role of Diabatic Heating (1200 UTC 24 July) 250-hPa wind speed (color shading in kt), 250-hPa potential vorticity (solid gray every 1 PVU), 250-hPa relative humidity (gray shading in %), 600–400-hPa layer-averaged ω (red every 5 × 10⁻³ hPa s-1, negative values only), 300–200-hPa layer-averaged irrotational wind (arrows, m s-1) Diabatic outflow from convection around TC Danny strengthens jet
Role of Diabatic Heating (1800 UTC 24 July) 250-hPa wind speed (color shading in kt), 250-hPa potential vorticity (solid gray every 1 PVU), 250-hPa relative humidity (gray shading in %), 600–400-hPa layer-averaged ω (red every 5 × 10⁻³ hPa s-1, negative values only), 300–200-hPa layer-averaged irrotational wind (arrows, m s-1) Diabatic outflow from convection around TC Danny strengthens jet
Ageostrophic Circulation and Frontogenesis Frontogenesis (shaded in K (100 km)-1 (3 h)-1), θ (solid black every 5 K), ω (dotted red every --4 × 10⁻³ hPa s-1), wind component normal to the cross section (solid brown, m s-1), and the ageostrophic wind component tangential to the cross section (arrows, m s-1) Divergent ageostrophic winds Upper-level jet Approximate Location of TC Danny 5 cm/s
Ageostrophic Circulation and Frontogenesis Frontogenesis (shaded in K (100 km)-1 (3 h)-1), θ (solid black every 5 K), ω (dotted red every --4 × 10⁻³ hPa s-1), wind component normal to the cross section (solid brown, m s-1), and the ageostrophic wind component tangential to the cross section (arrows, m s-1) Lower-tropospheric Frontogenesis 5 cm/s