Nematode Sampling and Economic Thresholds
Nematode Sampling and Economic Thresholds. Howard Ferris Department of Entomology and Nematology University of California, Davis hferris@ucdavis.edu April, 2012. Objectives of monitoring/sampling for nematodes A. Assess risk of loss i) Determine presence or absence

Nematode Sampling and Economic Thresholds
E N D
Presentation Transcript
Nematode SamplingandEconomic Thresholds Howard Ferris Department of Entomology and Nematology University of California, Davis hferris@ucdavis.edu April, 2012
Objectives of monitoring/sampling for nematodes A. Assess risk of loss i) Determine presence or absence a. assessment of long-term risk - perennials b. virus-vectors c. root crops - direct damage. d. exotic pests ii) Determine population abundance - relative/absolute a. predict potential yield/damage b. assess rate of population change (+ or -) iii) Determine spatial patterns. a. pattern of potential loss b. partial treatment/management B. Faunistic studies i) Community structure and ecosystem analysis a. foodweb structure and function ii) Environmental impacts/quality /markers a. effects of disturbance and contaminants b. recovery from perturbation iii) Collections / surveys a. faunal inventories b. biodiversity studies
Soil Food Webs – Environmental Effects on Structure Environmental heterogeneity Zones and Gradients: texture structure temperature water O2 CO2 NO3 NH4 minerals Separate metacommunities?
Biological/Ecological Considerations A. Factors Affecting Microdistribution i) Life history strategies a. feeding/parasitism b. reproductive behavior c. motilityii) Food distribution a. crop spacing b. root morphology iii) Ecological requirements a. moisture b. temperature (magnitude and stability) c. oxygen B. Factors Affecting Macrodistribution i) Crop history, management, field usage a. crop sequence b. spatial arrangement of previous crops ii) Age of infestation a. time to spread from a point source iii) Edaphic conditions a. soil texture patterns iv) Drainage patterns a. soil moisture levels b. soil aeration
Efficiency and Reliability - Optimal Sampling Methodology A. Pattern i) Organism moves to sampler a. only over small distances in soil organisms b. to roots of bioassay plants or to CO2 attractants. ii) Sampler moves to organism a. core sampling - aggregate samples b. symptom assessment, e.g. gall ratings - where possible iii) Field Stratification - based on macrodistribution parameters a. minimizes variance within each stratum b. increases confidence in estimate of mean c. allows determination of spatial pattern B. Timing i) To maximize probability of achieving objectives a. detect presence when populations highest b. greatest precision when lowest? - but may be many misses! ii) To allow evaluation and management decision a. prior to planting b. end of growing season, following treatment, etc.
As sample units become larger, perception of aggregated patterns: aggregated > random > uniform
Nematode Thresholds and Damage Levels Some of those involved…. • Dan Ball • Larry Duncan • Pete Goodell • Joe Noling • Diane Alston • Sally Schneider • Lance Beem
Seinhorst Damage Function • Y=m+(1-m)z(Pi-T) • Y=relative yield • m=minimum yield • Z=regression parameter • Pi=population level • T=tolerance level • Based on preplant population levels – measured or predicted from overwinter survival rates
The Economic Threshold That initial population at which the loss in value due to nematode damage is equal to the cost of nematode management
The Economic Threshold amended That initial population at which the difference in crop value with and without management is equal to the cost of the management
Thresholds and Expected Yield Loss Meloidogyne incognita, J2/250 cc soil; adjusted for extraction efficiency
Expected Damage Meloidogyne chitwoodi; summer crop potato; Klamath Basin Fall population levels; adjusted for extraction efficiency
Thresholds and Expected Yield Loss Heterodera schachtii, eggs/100g soil Sugarbeets Expected % yield loss at different preplant nematode densities
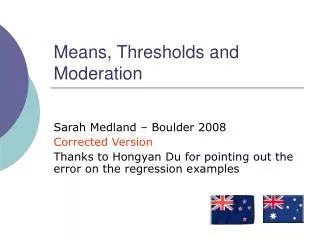
temporal avoidance
Year 1 Year 2 100 12000 10000 80 8000 60 LU LU AUC AUC 6000 40 LT LT 4000 20 NU NU 2000 0 NT NT 0 0 1000 2000 3000 0 1000 2000 3000 DD DD Year 3 30000 25000 20000 LU AUC 15000 LT 10000 NU 5000 0 NT 0 1000 2000 3000 DD
Noling and Ferris (1987)
References Burt, O. R. and H. Ferris. 1996. Sequential decision rules for managing nematodes with crop rotations. J. Nematology 28:457-474. Ferris, H. 1978. Nematode economic thresholds: derivation, requirements and theoretical considerations. J. Nematology 10:341-350. Ferris, H. 1985. Density-dependent nematode seasonal multiplication and overwinter survivorship: a critical point model. J. Nematology 17:93-100. Ferris, H., T. A. Mullens and K. E. Foord. 1990. Stability and characteristics of spatial description parameters for nematode populations. Journal of Nematology 22:427- 439. Kim D.G. and H. Ferris. 2002. Relationship between crop losses and initial population densities of Meloidogynearenaria in winter-grown oriental melon in Korea. J. Nematology 34:45-49. Noling, J.W. and H. Ferris. 1987. Nematode-degree days, a density-time model for relating epidemiology and crop losses in perennials. J. Nematology 19:108-118. Seinhorst, J.W. 1965. The relationship between nematode density and damage to plants. Nematologica11:137-154. Seinhorst, J.W. 1967. The relationship between population increase and population density in plant parasitic nematodes. II. Sedentary nematodes. Nematologica 13:157-171. More information: http://plpnemweb.ucdavis.edu/nemaplex