Nematode Sampling and Faunal Analysis
300 likes | 471 Vues
Nematode Sampling and Faunal Analysis. Howard Ferris Department of Nematology University of California, Davis hferris@ucdavis.edu March, 2005. Objectives of monitoring/sampling for nematodes A. Assess risk of loss i) Determine presence or absence

Nematode Sampling and Faunal Analysis
E N D
Presentation Transcript
Nematode SamplingandFaunal Analysis Howard Ferris Department of Nematology University of California, Davis hferris@ucdavis.edu March, 2005
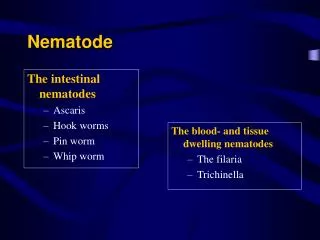
Objectives of monitoring/sampling for nematodes A. Assess risk of loss i) Determine presence or absence a. assessment of long-term risk - perennials b. virus-vectors c. root crops - direct damage. d. exotic pests ii) Determine population abundance - relative/absolute a. predict potential yield/damage b. assess rate of population change (+ or -) iii) Determine spatial patterns. a. pattern of potential loss b. partial treatment/management B. Faunistic studies i) Community structure and ecosystem analysis a. foodweb structure and function ii) Environmental impacts/quality /markers a. effects of disturbance and contaminants b. recovery from perturbation iii) Collections / surveys a. faunal inventories b. biodiversity studies
Soil Food Webs – Environmental Effects on Structure Environmental heterogeneity Zones and Gradients: texture structure temperature water O2 CO2 NO3 NH4 minerals Separate metacommunities?
Biological/Ecological Considerations A. Factors Affecting Microdistribution i) Life history strategies a. feeding/parasitism b. reproductive behavior c. motilityii) Food distribution a. crop spacing b. root morphology iii) Ecological requirements a. moisture b. temperature (magnitude and stability) c. oxygen B. Factors Affecting Macrodistribution i) Crop history, management, field usage a. crop sequence b. spatial arrangement of previous crops ii) Age of infestation a. time to spread from a point source iii) Edaphic conditions a. soil texture patterns iv) Drainage patterns a. soil moisture levels b. soil aeration
Efficiency and Reliability - Optimal Sampling Methodology A. Pattern i) Organism moves to sampler a. only over small distances in soil organisms b. to roots of bioassay plants or to CO2 attractants. ii) Sampler moves to organism a. core sampling - aggregate samples b. symptom assessment, e.g. gall ratings - where possible iii) Field Stratification - based on macrodistribution parameters a. minimizes variance within each stratum b. increases confidence in estimate of mean c. allows determination of spatial pattern B. Timing i) To maximize probability of achieving objectives a. detect presence when populations highest b. greatest precision when lowest? - but may be many misses! ii) To allow evaluation and management decision a. prior to planting b. end of growing season, following treatment, etc.
As sample units become larger, perception of aggregated patterns: aggregated > random > uniform
Nematode Thresholds and Damage Levels Some of those involved…. • Dan Ball • Larry Duncan • Pete Goodell • Joe Noling • Diane Alston • Sally Schneider • Lance Beem
Seinhorst Damage Function • Y=m+(1-m)z(Pi-T) • Y=relative yield • m=minimum yield • Z=regression parameter • Pi=population level • T=tolerance level • Based on preplant population levels – measured or predicted from overwinter survival rates
Thresholds and Expected Yield Loss Meloidogyne incognita, J2/250 cc soil; adjusted for extraction efficiency
Expected Damage Meloidogyne chitwoodi; summer crop potato; Klamath Basin Fall population levels; adjusted for extraction efficiency
Thresholds and Expected Yield Loss Heterodera schachtii, eggs/100g soil Sugarbeets Expected % yield loss at different preplant nematode densities
Soil Food Webs - Function • Decomposition of organic matter • Cycling of minerals and nutrients • Reservoirs of minerals and nutrients • Redistribution of minerals and nutrients • Sequestration of carbon • Degradation of pollutants, pesticides • Modification of soil structure • Community self-regulation • Biological regulation of pest species
The Nematode Fauna as a Soil Food Web Indicator Herbivores Bacterivores Fungivores Omnivores Predators
Enrichment Indicators Structure Indicators • Rhabditidae • Panagrolaimidae • etc. • Short lifecycle • Small/ Mod. body size • High fecundity • Small eggs • Dauer stages • Wide amplitude • Opportunists • Disturbed conditions • Aporcelaimidae • Nygolaimidae • etc. • Long lifecycle • Large body size • Low fecundity • Large eggs • Stress intolerant • Narrow amplitude • Undisturbed conditions Basal Fauna • Cephalobidae • Aphelenchidae, etc. • Moderate lifecycle • Small body size • Stress tolerant • Feeding adaptations • Present in all soils
Testable Hypotheses of Food Web Structure and Function • Disturbed • N-enriched • Low C:N • Bacterial • Conducive • Maturing • N-enriched • Low C:N • Bacterial • Regulated Enriched Ba1 Enrichment index Structured Fu2 • Degraded • Depleted • High C:N • Fungal • Conducive • Matured • Fertile • Mod. C:N • Bact./Fungal • Suppressive Fu2 Basal Ba2 Om4 Om5 Basal condition Ca3 Ca4 Ca5 Fu3 Fu4 Fu5 Ba3 Ba4 Ba5 Structure index Ferris et al. (2001)
Tomato Systems Yolo Co. Prune Orchards Yuba Co. Redwood Forest and Grass Mendocino Co. Mojave Desert Trajectory Analysis of Some California Soil Systems 100 Enrichment Index 50 0 0 50 100 Structure Index
Carbon Pathways and Pools Herbivory Fungal Omnivory Decomposition Bacterial
100 100 50 50 0 0 0 50 100 0 50 100 How Fragile is the System? Sampled 2000 Organically-managed for 12 years Sampled 2001 After Deep Tillage Enrichmentindex Structure index Structure index Berkelmans et al. (2003)
Some References • Bongers, T., H. Ferris. 1999. Nematode community structure as a bioindicator in environmental monitoring. Trends Ecol. Evol. 14, 224-228. • Duncan, L. W. and H. Ferris. 1983. Effects of Meloidogyne incognita on cotton and cowpeas in rotation. Proceedings of the Beltwide Cotton Production Research Conference: 22-26. • Ferris, H. 1984. Probability range in damage predictions as related to sampling decisions. Journal of Nematology 16:246-251. • Ferris, H., D. A. Ball, L. W. Beem and L. A. Gudmundson. 1986. Using nematode count data in crop management decisions. California Agriculture 40:12-14. • Ferris, H., T. Bongers, R. G. M. de Goede. 2001. A framework for soil food web diagnostics: extension of the nematode faunal analysis concept. Appl. Soil Ecol. 18, 13-29. • Ferris, H., P. B. Goodell, M. V. McKenry. 1981. Sampling for nematodes. California Agriculture 35:13-15. • Ferris, H., M.M. Matute. 2003. Structural and functional succession in the nematode fauna of a soil food web. Appl. Soil Ecol. 23:93-110. • Tenuta, M., H. Ferris. 2004. Relationship between nematode life-history classification and sensitivity to stressors: ionic and osmotic effects of nitrogenous solutions. J. Nematol. 36:85-94. More information: http://plpnemweb.ucdavis.edu/nemaplex/nemaplex.htm