Download
1 / 38
380 likes | 478 Vues
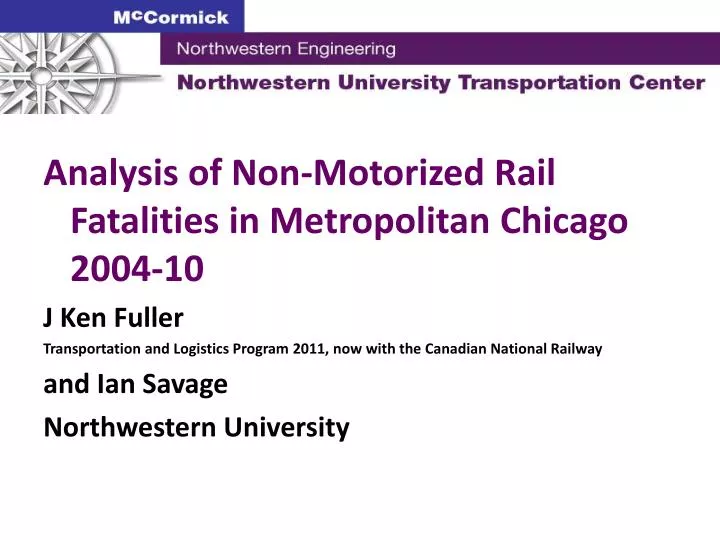
Analysis of Non-Motorized Rail Fatalities in Metropolitan Chicago 2004-10 J Ken Fuller Transportation and Logistics Program 2011, now with the Canadian National Railway and Ian Savage Northwestern University. Origin for this work.

E N D
Analysis of Non-Motorized Rail Fatalities in Metropolitan Chicago 2004-10 J Ken Fuller Transportation and Logistics Program 2011, now with the Canadian National Railway and Ian Savage Northwestern University
Origin for this work . . . A conversation with Marc Magliari of Amtrak at the NU/City of Lake Forest symposium in June 2010 Northwestern Transportation and Logistics Minor paper by Ken Fuller Subsequently revised and expanded Present an analysis that is both spatial (displayed in Google Earth) and statistical
Data Set . . . • 260 fatalities from 257 collisions between moving trains and non-motorized persons (251 pedestrians, 9 bicyclists, 0 on-train deaths) in seven-year period 2004-2010 in the 6-county Chicago Metropolitan region • Mainline railroads only, does not include Chicago Transit Authority rail service • Uses the Illinois Commerce Commission data base that was more expansive and inclusive than the “official” Federal Railroad Administration data
Illinois Commerce Commission data amalgamation of … Reports to Federal National Response Center Reports to Illinois Emergency Management Agency FRA Office of Safety official databases (FRA only started require reporting of suicides on July 1, 2011, but not for public reporting) News clips Police reports
Three Categories of Pedestrians . . . 260 “Pedestrian” deaths 2004-2010 in 6-county region • Suicides (120 deaths, 46%) • Non-suicides at stations and crossings (16 at stations, 43 at crossings, 59 total, 23%) • Non-suicides not at stations or crossings – “trespassers” (81 deaths, 31%)
Comparison with “official” FRA database ... • FRA fatality database* contains: • 56 of 59 (95%) of non-suicides at stations and crossings • 64 of 81 (79%) of non-suicide trespassers • 30 of 120 (25%) of suicides • Four fatalities are listed as non-fatal injury by FRA • At this time, suicides were not reportable to the FRA, but our classification of a “suicide” is more permissive • Undercounts in first two categories is surprising * FRA database contains five additional cases. Three do not meet the criteria for this analysis, one is a duplicate double-count, and one is incorrectly shown as occurring in the Chicago area
Pedestrians Crossings/Stations 59 Trespassers 81 Suicides 120 260 Other Fatalities Vehicle Occupants 29 Employees 5 Contractors 6 Passengers on Trains 4 Misc. other 3 47 As a comparison, fatalities 2004-10 . . .
Demographic Analysis Month and Time of Day Analysis
Fatalities by Gender . . . Considerable lack of information due to absence of gender field on FRA report form Females involved in 43% of station and crossing deaths, 22% of trespassing deaths, and 28% of suicides (where gender is known) Trespassing is overwhelmingly a male activity
Incidents by Age . . . Despite press attention, deaths involving persons aged under 19 (especially non-suicidal deaths) are surprising few In contrast to national data (where males in their 20s and 30s predominate), there is also a prevalence of 40-65 year old trespassers in Illinois There are less incidents of trespassing and suicides by senior citizens than one might have imagined
Fatalities by Time of Year . . . Fatalities are higher in the warmer months Trespassing deaths peak in May and November 30% of station/crossing deaths occurred in the month of June The peak months for suicides are March to October, with November through February having lower counts
Fatalities by Time of Day . . . 58% of station/crossing fatalities occurred in the commute hours of 7am-9am and 3pm-7pm Trespassing fatalities are equally spread across all hours of day and night Suicides are distributed across the day with hotspots in the 1am, 7am, noon, 5pm and 6pm hours
Fatalities by Day of Week. . . Surprising consistency across the week Trespassing fatalities do not increase on the weekend (of course, there are less trains) Perhaps some increase in suicides on a Friday
Three Categories of Pedestrians . . . Suicides (light blue marker) Non-suicides at stations and crossings (red marker with a cross) Non-suicides not at stations or crossings – “trespassers” (yellow marker with a star) Location of six trespassing cases could not be accurately determined
Risk by Metra Route … Annual risk per million population in communities route passes through (2010 Census) Calculated based on fatalities and population in the suburbs, and excludes the City of Chicago
Risk by Metra Route … Adjust the annual risk per million population in communities route passes through (2010 Census) by the annual number of trains Multiply by a million for ease of display Remember this is based on fatalities and population in the suburbs, and excludes the City of Chicago
Top 10 Riskiest Communities . . .10,000 + population and 3 or more fatalities
OL in Top 10 Riskiest Communities . . .10,000 + population and 3 or more fatalities
Analysis by Suburban Municipality … Correlations for 137 suburban municipalities that have a Metra route pass through them Look at correlations with annual fatality risk per 10,000 population We have data on the number of Operation Lifesaver presentations and events2004-10 and the number of attendees
In Conclusion . . . Pedestrian fatalities dwarf motor vehicle fatalities (260 to 29) Suicides are at least 46% of the total Victims are typically adults, not minors or seniors Geographically, incidents do not seem to be random
Contact Information . . . ipsavage@northwestern.edu (847) 491-8241 Read my rail safety papers at: http://faculty.wcas.northwestern.edu/~ipsavage/rail.html