Analyzing Michigan's Public vs. Private Sector Wages and Employment Trends
270 likes | 359 Vues
Explore the disparities between state/local government and private sector wages in Michigan, impacting employment growth and economic trends.

Analyzing Michigan's Public vs. Private Sector Wages and Employment Trends
E N D
Presentation Transcript
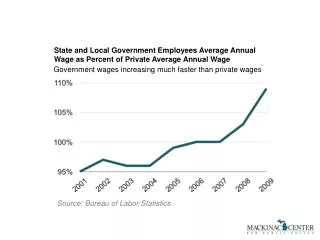
State and Local Government Employees Average Annual Wage as Percent of Private Average Annual Wage Government wages increasing much faster than private wages Source: Bureau of Labor Statistics
State and Local Government Jobs as Percent of Total Michigan Employment Michigan's private sector has to support greater share of public sector, complicated by local privatization efforts Source: Bureau of Labor Statistics
Michigan Public vs. Private Average Hourly Compensation This comparison shows the inequity between public-sector and private-sector employees for overall compensation $14.90 $8.24 $25.02 $18.89 Government Private Sector Classified Source: Calculations based on data fromthe Bureau of Labor Statistics and theMichigan Civil Service Commission
Per-capita personal income growth, 2000-2010 Extremes do well, 6 RTW states PCPI *RTW States Source: Bureau of Economic Analysis
Employment growth, 2000-2010 7 of 10 top states are RTW *RTW States Source: Bureau of Labor Statistics
Population change, 2000 to 2010 9 of 10 top states are RTW *RTW States Source: U.S. Census Bureau
Average of three growth metrics 6 of the top 10 are RTW, the bottom 10 are all non-RTW Rank Rank *RTW States Source: Author's calculations
Growth of Population Aged 25-34 From 2000 to 2010 RTW: Winning at young people Source: U.S. Census Bureau
Payroll Employment Growth Since Recession Began -0.8% -6.6% -10.8% 4.2% State Government Total Government Local Government Private Source: Bureau of Labor Statistics
Per-capita Gross Domestic Product What Lansing's bureaucrats and politicians have done to Michigan — Will they pay, or will it be us? US MI Source: Bureau of Economic Analysis
Annual Employment Growth Michigan and non-RTW states underperform each year Source: Bureau of Labor Statistics
Cumulative Employment Growth RTW states grew 6 percentage points more than non-RTW and 17 percentage points over Michigan since 2001 RTW non-RTW MI Source: Bureau of Labor Statistics
Cumulative Gross Domestic Product Growth Over time, RTW outperforms non-RTW while Michigan lost GDP RTW non-RTW MI Source: Bureau of Economic Analysis
Annual Gross Domestic Product Growth RTW states outperform most years Source: Bureau of Economic Analysis
Michigan Four-Quarter Percent Change in FHFA State-Level House Price Indexes Michigan's real estate bust Source: Federal Housing Finance Agency
MI Manufacturing Jobs Since 2000, Michigan has lost half its manufacturing jobs. Losses stemmed in 2010 Source: Bureau of Labor Statistics
Unemployment Rate After the worst record of unemployment, Michigan's rate is falling fast MI US Source: Bureau of Labor Statistics
Labor Force Over time, RTW outperforms non-RTW while Michigan lost GDP US MI Source: Bureau of Labor Statistics
Employment Trends Michigan's level of employment is back to where we were in 1989 US MI Source: Bureau of Labor Statistics
Employment Losses Michigan hit harder than US in recent recession, improving quicker, but has not caught back up US MI Source: Bureau of Labor Statistics
Michigan Per Capita Personal Income as Percent of US Michigan is now a poor state and has been below the national average since 1996 Source: Bureau of Economic Analysis
Michigan’s Outbound Migration Source: United Van Lines
Home Permits in Michigan Source: U.S. Census Bureau.
U6 Unemployment Expanded definition of unemployment shows Michigan more responsive to recession MI US Source: Bureau of Labor Statistics
State and Local Government Private Sector
Payroll Employment Growth Since Recession Began -0.8% -6.6% -10.8% 4.2% State Government Total Government Local Government Private Source: Bureau of Labor Statistics
Average Costs for Health Insurance Family Premiums, 2009 Source: Mackinac Center, Kaiser Family Foundation