Download
1 / 25
260 likes | 572 Vues
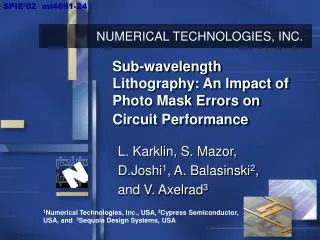
SPIE’02 ml4691-24. Sub-wavelength Lithography: An Impact of Photo Mask Errors on Circuit Performance. L. Karklin, S. Mazor, D.Joshi 1 , A. Balasinski 2 , and V. Axelrad 3. 1 Numerical Technologies, Inc., USA, 2 Cypress Semiconductor, USA, and 3 Sequoia Design Systems, USA. Agenda.

E N D
SPIE’02 ml4691-24 Sub-wavelength Lithography: An Impact of Photo Mask Errors on Circuit Performance L. Karklin, S. Mazor, D.Joshi1, A. Balasinski2, and V. Axelrad3 1Numerical Technologies, Inc., USA, 2Cypress Semiconductor, USA, and 3Sequoia Design Systems, USA
Agenda • Introduction • Experimental conditions • Simulation flow • Sensitivity analysis • Monte Carlo simulation of mask CD errors • Results and discussion • Lithography data • Device and circuit simulation • Summary
The sub-wavelength era impacts the full design-to-manufacturing flow SILICON WAFER = MASK = LAYOUT MASK LAYOUT SILICON WAFER MASK SILICON WAFER • Above Wavelength • What is drawn in design is printed on Silicon - “WYSIWYG” • SubWavelength
DESIGN MASK LAYOUT MASK SILICON DEVICE ITRS 2001, SEMATECH We need new design software and infrastructure to account for process effects and distortions from design through final device The photomask is the most critical link in that flow
DESIGN MASK MASK LAYOUT LAYOUT MASK MASK SILICON SILICON DEVICE DEVICE Simulation flow
Sensitivity analysis Litho data Experimental flow Device and circuit simulation
Photo Mask CD Distribution Wafer CD Distribution Wafer CD Distribution ICWB NA, s, RET SDD Experimental flow Device Parameters • Device Parametric Yield • Circuit (Ring Oscillator)C:\Circuit.ppt
Lithography options • Design Rules: • Design: An Isolated line CD=80 nm , Dense lines pitch=220nm • Target CD =70 nm (in resist, all dimensions are on wafer scale) • l=248 nm (KrF) and l= 193 nm (ArF); • 4x Reduction mask; • NA=0.75; • Conventional (circular) Illumination: s=0.75; • RET used: • Annular Illumination: sin= 0.60; sout= 0.80; • Scatter Bars: 40 nm, optimized placement (based on min. MEF) • PSM: EAPSM, Phase=180°, T=10%
MOSFET Lpoly 70 nm Sensitivity analysis • SEQUOIA Design Systems’ Sensitivity Analysis estimates device variability for a given level of manufacturing control • For a 70nm device we obtain: Vth=340mV±13mVIdsat=1mA±0.09mA
Variability sources • Main source of variability is CD Control (Lpoly) • Lpoly responsible for 71% of Vth variability • Lpoly responsible for 84% of Idsat variability Vth Idsat
-3s +3s Lpoly Lpoly (Gate) CD variations Gaussian Distribution 10,000 Samples 3s = 20 nm, 40 nm;
Mask Yield Projections - Historical Base Slide courtesy of Brian Grenon, Grenon Consulting, Inc.
5 nm on wafer 10 nm on wafer Mask CD uniformity Data courtesy of Anja Rosenbusch, Etec Systems Inc., an Applied Materials Company
Mask CD distribution mapped to the wafer CD distribution Wafer CD distribution depends on the lithography options used
Wafer [nm] Design [nm] Mask linearity data
+/- 3s +/- 3s +/- 3s +/- 3s Simulated wafer CD distribution 193 nm Annular 193 nm Circular 248 nm Annular 248 nm Circular
Wafer CD (Lpoly) distribution translated to MOSFET Vth distribution
Wafer CD (Lpoly) distribution translated to ring oscillator speed
Statistical analysis of the simulated data Using SDD one can calculate a fractional yield based on custom specifications
Ring oscillator frequency distribution 3s=20 nm* 3s=40 nm* * On the 4x Mask
Summary • We presented a comprehensive method by which to evaluate the layout/mask dependent device and circuit performance for different lithography options. • We simulated large numbers of random mask errors and propagated these data through the virtual MOSFET manufacturing pipeline by using fast lithography and device simulators linked together. • Using statistical analysis we estimated the impact of mask CD errors (3s) and lithography options (RET) on the printed wafer data and final circuit (RO) performance. • Proposed methodology can be applied either to simulated data or to experimental data.