Solutions for Reducing Energy Waste and Enhancing Sustainability
480 likes | 610 Vues
This comprehensive overview focuses on innovative strategies for reducing energy waste while minimizing environmental impact. Key benefits include prolonging fossil fuel supplies, decreasing oil imports, and improving local economies through job creation. The analysis emphasizes the significance of transitioning to renewable energy sources, enhancing energy efficiency, and addressing pollution. With data-driven insights into energy use and efficiency metrics, we highlight the importance of reducing energy waste as a pathway to a sustainable future and better energy security.

Solutions for Reducing Energy Waste and Enhancing Sustainability
E N D
Presentation Transcript
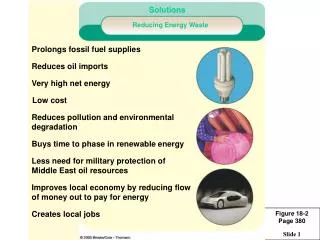
Figure 18-2Page 380 Solutions Solutions Reducing Energy Waste Reducing Energy Waste Prolongs fossil fuel supplies Reduces oil imports Very high net energy Low cost Reduces pollution and environmental degradation Buys time to phase in renewable energy Less need for military protection of Middle East oil resources Improves local economy by reducing flow of money out to pay for energy Creates local jobs
Energy Inputs System Outputs Figure 18-3Page 381 9% 7% 41% U.S. economy and lifestyles 86% 43% 8% 3% 3% Nonrenewable fossil fuels Useful energy Petrochemicals Nonrenewable nuclear Unavoidable energy waste Hydropower, geothermal, wind, solar Unnecessary energy waste Biomass
Figure 18-4Page 381 1.4 1.2 Energy useper capita 1.0 Index of energy use per capita andper dollar of GDP (Index: 1970=1) 0.8 0.6 0.4 Energy useper dollar of GDP 0.2 0 1970 1980 1990 2000 2010 2020 Year
Figure 18-5aPage 381 H2 O2 H2O KOH Fuel cell 45-65%
Figure 18-5bPage 381 Steam turbine 45%
Figure 18-5cPage 381 Human body 20–25%
Figure 18-5dPage 381 Fluorescent light 22%
Figure 18-5ePage 381 Internal combustion engine (gasoline) 20-25%
Figure 18-5fPage 381 Incandescent light 5%
Stepped ArtFigure 18-6Page 382 Uranium mining (95%) Uranium processing and transportation (57%) Power plant (31%) Transmission of electricity (85%) Resistance heating (100%) Uranium 100% 14% 14% 17% 95% 54% Waste heat Waste heat Waste heat Waste heat Electricity from Nuclear Power Plant Sunlight 100% 90% Waste heat Passive Solar Window transmission (90%)
Figure 18-7Page 383 30 25 Cars Average fuel economy (miles per gallon, or mpg) 20 Both 15 Pickups, vans, and sport utility vehicles 10 1985 1970 1975 1980 2005 2000 1990 1995 Model Year
Figure 18-8Page 383 2.2 2.0 1.8 1.6 Dollars per gallon (in 1993 dollars) 1.4 1.2 1.0 0.8 1920 1930 1940 1950 1960 1970 1980 1990 2000 2010 Year
Figure 18-9Page 385 A C Electric motor Traction drive provides additional power, recovers breaking energy to recharge battery. Combustion engine Small, efficient internalcombustion engine powers vehicle with low emissions. D B Fuel tank Liquid fuel such as gasoline, diesel, or ethanol runs small combustion engine. Battery bank High-density batteries power electric Motor for increased power. E Regulator Controls flow of power between electric Motor and battery pack. F Transmission Efficient 5-speed automatic transmission. B A E F C D Fuel Electricity
Figure 18-10aPage 385 1 2 Hydrogen gas 3 4 H2 Cell splits H2 into protons and electrons. Protons flow across catalyst membrane. 3 1 O2 React with oxygen (O2). 2 Produce electrical energy (flow of electrons) to power car. 4 H2O Emits water (H2O) vapor.
Figure 18-10bPage 385 Fuel cell stack Hydrogen and oxygen combine chemically to produce electricity. Fuel tank Hydrogen gas or liquid or solid metal hydride stored on board or made from gasoline or methanol. A C D B Turbo compressor Sends pressurized air to fuel cell. E Traction inverter Module converts DC electricity from fuel cell to AC for use in electric motors. Electric motor/transaxle Converts electrical energy to mechanical energy to turn wheels. B A E C D Fuel Electricity
Figure 18-11aPage 386 Universal docking connection Connects the chassis with the Drive-by-wire system in the body Body attachments Mechanical locks that secure the body to the chassis Rear crush zone absorbs crash energy Air system management Fuel-cell stack Converts hydrogen fuel into electricity Drive-by-wire system controls Cabin heating unit Side mounted radiators Release heat generated by the fuel cell, vehicle electronics, and wheel motors Front crush zone Absorbs crash energy Hydrogen fuel tanks Electric wheel motors Provide four-wheel drive Have built-in brakes
R-60 or higher insulation Figure 18-12Page 387 R-30 to R-43 insulation Small or no north-facing windows or superwindows Insulated glass, triple-paned or superwindows (passive solar gain) R-30 to R-43 insulation House nearly airtight R-30 to R-43 insulation Air-to-air heat exchanger
Figure 18-13Page 387 DO NOT POST TO INTERNET
Figure 18-14Page 388 DO NOT POST TO INTERNET
Net Energy Efficiency Superinsulated house(100% of heat R-43) 98% Geothermal heat pumps (100% of heating and cooling)) 96% Passive solar (100% of heat) 90% Passive solar (50% of heat) plus high- efficiency natural gas furnace(50% of heat) 87% Natural gas with high-efficiency furnace 84% Electric resistance heating (electricity from hydroelectric power plant) 82% Natural gas with typical furnace 70% Passive solar (50% of heat) plus high-efficiency wood stove (50% of heat) 65% Oil furnace 53% Electric heat pump (electricity from coal-fired power plant) 50% High-efficiency wood stove 39% Active solar 35% Electric heat pump (electricity from nuclear plant) 30% Typical wood stove 26% Electric resistance heating (electricity from coal-fired power plant) 25% Electric resistance heating (electricity from nuclear plant) 14% Figure 18-15Page 389
Figure 18-16aPage 389 Summer sun Heavy insulation Superwindow Winter sun Superwindow Stone floor and wall for heat storage PASSIVE
Figure 18-16bPage 389 Heat to house (radiators or forced air duct) Pump Heavy insulation Hot water tank Super- window Heat exchanger ACTIVE
Direct Gain Figure 18-17aPage 392 Ceiling and north wall heavily insulated Summer sun Hot air Super insulated windows Winter sun Warm air Cool air Earth tubes
Greenhouse, Sunspace, or Attached Solarium Figure 18-17bPage 392 Summer cooling vent Warm air Insulated windows Cool air
Figure 18-17cPage 392 Earth Sheltered Reinforced concrete, carefully waterproofed walls and roof Earth Triple-paned or superwindows Flagstone floor for heat storage
Figure 18-18Page 392 Trade-offs Passive or Active Solar Heating Advantages Disadvantages Energy is free Net energy is moderate (active) to high (passive) Quick installation No CO2 emissions Very low air and water pollution Very low land disturbance (built into roof or window) Moderate cost (passive) Need access to sun 60% of time Blockage of sun access by other structures Need heat storage system High cost (active) Active system needs maintenance and repair Active collectors unattractive
Figure 18-19Page 393 Trade-Offs Solar Energy for High-Temperature Heat and Electricity Advantages Disadvantages Moderate net energy Moderate environmental Impact No CO2 emissions Fast construction (1-2 years) Costs reduced with natural gas turbine backup Low efficiency High costs Needs backup or storage system Need access to sun most of the time High land use May disturb desert areas
Figure 18-20aPage 394 Single Solar Cell Boron-enriched silicon Sunlight Junction Cell Phosphorus- enriched silicon DC electricity
Figure 18-20bPage 394 Roof Options Panels of Solar Cells Solar Cells
Figure 18-20cPage 394 Solar Cell Roof
Figure 18-21Page 395 Trade-Offs Solar Cells Advantages Disadvantages Fairly high net energy Work on cloudy days Quick installation Easily expanded or moved No CO2 emissions Low environmental impact Last 20-40 years Low land use (if on roof or built into walls or windows) Reduce dependence on fossil fuels Need access to sun Low efficiency Need electricity storage system or backup High land use (solar cell power plants) could disrupt desert areas High costs (but should be competitive in 5-15 years) DC current must be converted to AC
Trade-Offs Large-Scale Hydropower Advantages Disadvantages Moderate to high net energy High efficiency (80%) Large untapped potential Low-cost electricity Long life span No CO2 emissions during operation May provide flood control below dam Provides water for year-round irrigation of crop land Reservoir is useful for fishing and recreation High construction costs High environmental impact from flooding land to form a reservoir High CO2 emissions from biomass decay in shallow tropical reservoirs Floods natural areas behind dam Converts land habitat to lake habitat Danger of collapse Uproots people Decreases fish harvest below dam Decreases flow of natural fertilizer (silt) to land below dam Figure 18-22Page 396
Figure 18-23aPage 396 Gearbox Electrical generator Power cable Wind Turbine
Figure 18-23bPage 396 Wind Farm
Figure 18-24Page 397 Trade-Offs Wind Power Advantages Disadvantages Moderate to high net energy High efficiency Moderate capital cost Low electricity cost (and falling) Very low environmental impact No CO2 emissions Quick construction Easily expanded Land below turbines can be used to grow crops or graze livestock Steady winds needed Backup systems when needed winds are low High land use for wind farm Visual pollution Noise when located near populated areas May interfere in flights of migratory birds and kill birds of prey
Figure 18-25Page 398 Solid Biomass Fuels Wood logs and pellets Charcoal Agricultural waste (stalks and other plant debris) Timbering wastes (branches, treetops, and wood chips) Animal wastes (dung) Aquatic plants (kelp and water hyacinths) Urban wastes (paper, cardboard, and other combustible materials) Conversion to gaseous and liquid biofuels Direct burning Gaseous Biofuels Synthetic natural gas(biogas) Wood gas Liquid Biofuels Ethanol Methanol Gasohol
Figure 18-26Page 399 Trade-Offs Solid Biomass Advantages Disadvantages Large potential supply in some areas Moderate costs No net CO2 increase if harvested and burned sustainably Plantation can be located on semiarid land not needed for crops Plantation can help restore degraded lands Can make use of agricultural, timber, and urban wastes Nonrenewable if harvested unsustainably Moderate to high environmental impact CO2 emissions if harvested and burned unsustainably Low photosynthetic efficiency Soil erosion, water pollution, and loss of wildlife habitat Plantations could compete with cropland Often burned in inefficient and polluting open fires and stoves
Figure 18-27Page 399 Trade-Offs Ethanol Fuel Advantages Disadvantages High octane Some reduction in CO2 emission Reduced CO emissions Can be sold as gasohol Potentially renewable Large fuel tank needed Lower driving range Net energy loss Much higher cost Corn supply limited May compete with growing food on cropland Higher NO emission Corrosive Hard to start in colder weather
Figure 18-28Page 400 Trade-Offs Methanol Fuel Advantages Disadvantages High octane Some reduction in CO2 emissions Lower total air Pollution (30-40%) Can be made from natural gas, agricultural wastes, sewage sludge, and garbage Can be used to produce H2 for fuel cells Large fuel tank needed Half the driving range Corrodes metal, rubber, plastic High CO2 emissions if made from coal Expensive to produce Hard to start in cold weather
Figure 18-29Page 401 Trade-Offs Geothermal Fuel Advantages Disadvantages Very high efficiency Moderate net energy at accessible sites Lower CO2 emissions than fossil fuels Low cost at favorable sites Low land use Low land disturbance Moderate environmental impact Scarcity of suitable sites Depleted if used too rapidly CO2 emissions Moderate to high local air pollution Noise and odor (H2S) Cost too high except at the most concentrated and accessible source
Figure 18-30Page 401 Trade-Offs Hydrogen Advantages Disadvantages Can be produced from plentiful water Low environmental impact Renewable if produced From renewable energy resources No CO2 emissions if produced from water Good substitute for oil Competitive price if environmental and social costs are included in cost comparisons Easier to store than electricity Safer than gasoline and natural gas Nontoxic High efficiency (65-95%) in fuel cells Not found in nature Energy is needed to produce fuel Negative net energy CO2 emissions if produced from carbon-containing compounds Nonrenewable if generated by fossil fuels or nuclear power High costs (but expected to come down) Will take 25 to 50 years to phase in Short driving range for current fuel cell cars No distribution system in place Excessive H2 leaks may deplete ozone
Figure 18-31Page 403 Primary Energy Sources Hydrogen Production Transport Storage Utilization Photo-conversion Sunlight Electric utility Wind Electricity Generation Commercial/Residential Electrolysis Vehicles and pipeline Biomass Transportation Gas and solids Reforming Fossil fuels Industrial
Wind farm Bioenergy Power plants Figure 18-32Page 405 Small solar cell power plants Fuel cells Rooftop solar cell arrays Solar cell rooftop systems Transmission and distribution system Commercial Small wind turbine Residential Industrial Microturbines
Small modular units Fast factory production Fast installation (hours to days) Can add or remove modules as needed High energy efficiency (60–80%) Low or no CO2 emissions Low air pollution emissions Reliable Easy to repair Much less vulnerable to power outages Increase national security by dispersal of targets Useful anywhere Especially useful in rural areas in developing countries with no power Can use locally available renewable energy resources Easily financed (costs included in mortgage and commercial loan) Figure 18-33Page 406
Figure 18-34Page 407 $73 billion Nuclear energy (fission and fusion) $32 billion Fossil fuels $19 billion Renewable energy Energy efficiency (conservation) $15 billion
Figure 18-35Page 407 More Renewable Energy Improve Energy Efficiency Increase renewable energy to 20% by 2020 and 50% by 2050 Increase fuel-efficiency standards for vehicles, buildings, and appliances Provide large subsidies and tax credits for renewable energy Use full-cost accounting and life cycle cost for comparing all energy alternatives Mandate government purchases of efficient vehicles and other devices Encourage government purchase of renewable energy devices Provide large tax credits for buying efficient cars, houses, and appliances Greatly increase renewable energy research and development Offer large tax credits for investments in efficiency Reduce Pollution and Health Risk Reward utilities for reducing demand Cut coal use 50% by 2020 Phase out coal subsidies Encourage independent power producers Levy taxes on coal and oil use Phase out nuclear power or put it on hold until 2020 Greatly increase efficiency research and development Phase out nuclear power subsidies
Figure 18-36Page 408 What Can You Do? Energy Use ad Waste • Drive a car that gets at least 15 kilometers per liter (35 miles per gallon) and join a carpool. • Use mass transit, walking, and bicycling. • Superinsulate your house and plug all air leaks. • Turn off lights, TV sets, computers, and other electronic equipment when they are not in use. • Wash laundry in warm or cold water. • Use passive solar heating. • For cooling, open windows and use ceiling fans or whole-house attic or window fans. • Turn thermostats down in winter and up in summer. • Buy the most energy-efficient homes, lights, cars, and appliances available. • Turn down the thermostat on water heaters to 43-49ºC (110-120ºF) and insulate hot water heaters and pipes.