Download
1 / 61
610 likes | 735 Vues
Photovoltaic Solar Energy Futures. Presented to the Minnesota Futurists 16 May 2009 Dick Saunders and David Keenan. But first a word from our sponsor. The Futurist Tool of the day Trend Analysis and Extrapolation. Trend Analysis & Extrapolation. A Method Everyone Uses

E N D
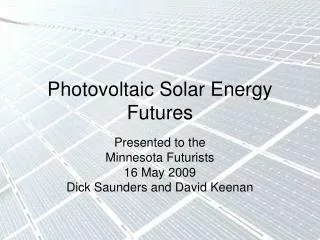
Photovoltaic Solar EnergyFutures Presented to the Minnesota Futurists 16 May 2009 Dick Saunders and David Keenan
But first a word from our sponsor The Futurist Tool of the day Trend Analysis and Extrapolation
Trend Analysis & Extrapolation • A Method Everyone Uses • Trend analysis involves the use of any of a variety of techniques based on historical data. • Trend analysis involves several processes. One process is spotting an emerging trend, that is, identifying a change in the world around us. • Now you need to do some analysis to see what the nature of the trend is and what its implications might be. • You could first look at historical data http://crab.rutgers.edu/~goertzel/futuristmethods.htm
Trend Analysis & Extrapolation • Trend analysis requires that you do more than simply extrapolate the trend forward. • You have to ask, what is causing this trend, and will those causes continue indefinitely? • Are there upper limits to the trend? • What other forces may affect the trend? • At this point trend analysis relies more on subjective judgment rather than objective extrapolation of historical data. • Assuming that the future will be like the past or that past changes will continue in the same direction and rate is a perfectly sensible way to begin trying to understand the future. • It can not, however, be the end of our endeavors, or we would end up with absurd results. http://crab.rutgers.edu/~goertzel/futuristmethods.htm
Trends to Analyze in This Talk • Solar Cells • Market size • Market share • Sales • Units • Power produced • Cost per power delivered
Agenda • The Sun • Solar Cells • Background • How they work • Types • Markets • Costs • Countries • Companies • Questions
Energy from the Sun • About half the incoming solar energy reaches the Earth's surface. • The Earth receives 174 petawatts (PW) (1015 watts) of incoming solar radiation at the upper atmosphere. Approximately 30% is reflected back to space while the rest is absorbed by clouds, oceans and land masses. • Earth's land surface, oceans and atmosphere absorb solar radiation, and this raises their temperature. Sunlight absorbed by the oceans and land masses keeps the surface at an average temperature of 14 °C. • By photosynthesis green plants convert solar energy into chemical energy, which produces food, wood and the biomass from which fossil fuels are derived. http://en.wikipedia.org/wiki/Solar_energy
Breakdown of incoming solar energy http://en.wikipedia.org/wiki/File:Breakdown_of_the_incoming_solar_energy.svg
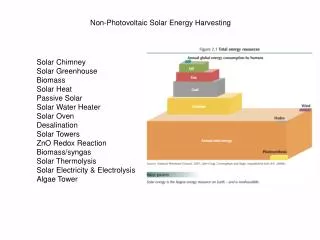
Energy from the Sun Yearly Solar fluxes & Human Energy Consumption • The total solar energy absorbed by Earth's atmosphere, oceans and land masses is approximately 3,850,000 exajoules (EJ) (1018 joules) per year. (70% of incoming sunlight) (1 Joule = energy required to heat one gram of dry, cool air by 1˚ C) • Primary energy use (2005) 487 EJ (0.0126%) • Electricity (2005) 56.7 EJ (0.0015%)Therefore a good target • 2002, more energy in one hour than the world used in the year. • Photosynthesis captures approximately 3,000 EJ per year in biomass. • The amount of solar energy reaching the surface of the planet is so vast that in one year it is about twice as much as will ever be obtained from all of the Earth's non-renewable resources of coal, oil, natural gas, and mined uranium combined. • As intermittent resources, solar and wind raise issues. http://en.wikipedia.org/wiki/Solar_energy
Solar Cells Background • 1839 - French physicist A. E. Becquerel first recognized the photovoltaic effect. • Photo+voltaic = convert light to electricity • 1883 - first solar cell built, by Charles Fritts, coated semiconductor selenium with an extremely thin layer of gold to form the junctions. • 1954 - Bell Laboratories, experimenting with semiconductors, accidentally found that silicon doped with certain impurities was very sensitive to light. Daryl Chapin, Calvin Fuller and Gerald Pearson, invented the first practical device for converting sunlight into useful electrical power. Resulted in the production of the first practical solar cells with a sunlight energy conversion efficiency of around 6%. • 1958 - First spacecraft to use solar panels was US satellite Vanguard 1 http://en.wikipedia.org/wiki/Solar_cell
PV Solar for Electricity Photovoltaics • For the 2 billion people without access to electricity, it would be cheaper to install solar panels than to extend the electrical grid. (The Fund for Renewable Energy Everywhere) • Providing power for villages in developing countries is a fast-growing market for photovoltaics. The United Nations estimates that more than 2 million villages worldwide are without electric power for water supply, refrigeration, lighting, and other basic needs, and the cost of extending the utility grids is prohibitive, $23,000 to $46,000 per kilometer in 1988. • A one kilowatt PV system* each month: • prevents 150 lbs. of coal from being mined • prevents 300 lbs. of CO2 from entering the atmosphere • keeps 105 gallons of water from being consumed • keeps NO and SO2 from being released into the environment * in Colorado, or an equivalent system that produces 150 kWh per month http://www.solarenergy.org/resources/energyfacts.html
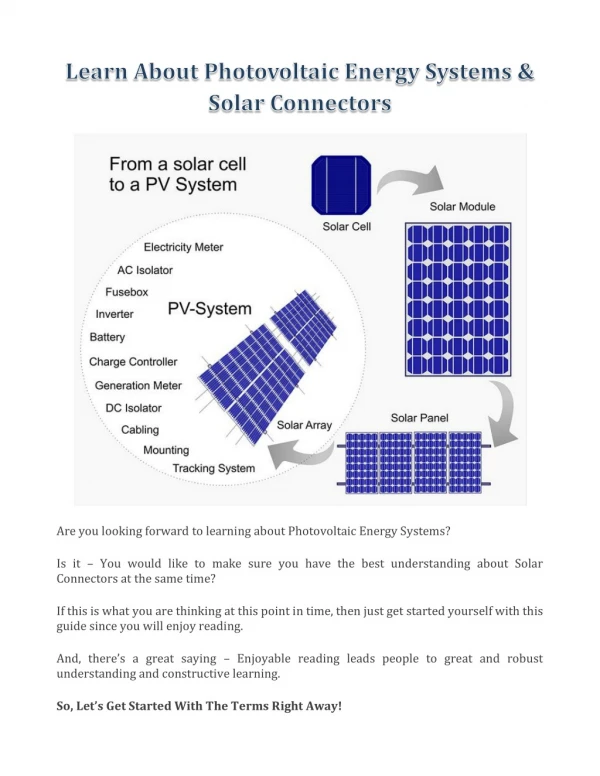
How Solar Cells Work • Photons in sunlight hit the solar panel and are absorbed by semiconducting materials, such as silicon. • Electrons (negatively charged) are knocked loose from their atoms, allowing them to flow through the material to produce electricity. • An array of solar cells converts solar energy into a usable amount of direct current (DC) electricity. http://en.wikipedia.org/wiki/File:Silicon_Solar_cell_structure_and_mechanism.svg
Solar Cells Background Three generations of solar cells • Solar Cells are classified into three generations which indicates the order of which each became important. • At present there is concurrent research into all three generations while the first generation technologies are most highly represented in commercial production, accounting for 89.6% of 2007 production. http://en.wikipedia.org/wiki/Solar_cell
First Generation – Single Junction Silicon Cells 89.6% of 2007 Production 45.2% Single Crystal Si 42.2% Multi-crystal SI Large-area, high quality and single junction devices. High energy and labor inputs which limit significant progress in reducing production costs. Single junction silicon devices are approaching theoretical limit efficiency of 33%. Achieve cost parity with fossil fuel energy generation after a payback period of 5–7 years. (3.5 yr in Europe) Single crystal silicon - 16-19% efficiency Multi-crystal silicon - 14-15% efficiency Solar Cells Background Silicon Cell Average Efficiency http://en.wikipedia.org/wiki/Solar_cell and www.epia.org Solar Generation V Report Sept 08
Solar Cells Background Second Generation – Thin Film Cells CdTe 4.7% & CIGS 0.5% of 2007 Production • New materials and processes to improve efficiency and reduce cost. • As manufacturing techniques evolve, production costs will be dominated by constituent material requirements, whether this be a silicon substrate, or glass cover. Thin film cells use about 1% of the expensive semiconductors compared to First Generation cells. • The most successful second generation materials have been cadmium telluride (CdTe), copper indium gallium selenide (CIGS), amorphous silicon and micromorphous silicon. • Trend toward second gen., but commercialization has proven difficult. • 2007 - First Solar produced 200 MW of CdTe solar cells, 5th largest producer in 2007 and the first to reach top 10 from of second generation technologies alone. • 2007 - Wurth Solar commercialized its CIGS technology producing 15 MW. • 2007 - Nanosolar commercialized its CIGS technology in 2007 with a production . capacity of 430 MW for 2008 in the USA and Germany. • 2008 - Honda began to commercialize their CIGS base solar panel. • CdTe – 8 – 11% efficiency (18% demonstrated) • CIGS – 7-11% efficiency (20% demonstrated) • Payback time < 1 year in Europe http://en.wikipedia.org/wiki/Solar_cell and www.epia.org Solar Generation V Report Sept 08
Solar Cells Background Third Generation – Multi-junction Cells • Third generation technologies aim to enhance poor electrical performance of second generation (thin-film technologies) while maintaining very low production costs. • Current research is targeting conversion efficiencies of 30-60% while retaining low cost materials and manufacturing techniques. They can exceed the theoretical solar conversion efficiency limit for a single energy threshold material, 31% under 1 sun illumination and 40.8% under the maximal artificial concentration of sunlight (46,200 suns). • Approaches to achieving these high efficiencies including the use of multijunction photovoltaic cells, concentration of the incident spectrum, the use of thermal generation by UV light to enhance voltage or carrier collection, or the use of the infrared spectrum for night-time operation. • Typically use fresnel lens (3M) or other concentrators, but cannot use diffuse sunlight and require sun tracking hardware • Multi-junction cells – 30% efficiency (40-43% demonstrated) http://en.wikipedia.org/wiki/Solar_cell and www.epia.org Solar Generation V Report Sept 08
Global Cumulative PV Power http://www.epia.org/fileadmin/EPIA_docs/publications/epia/Global_Market_Outlook_Until_2013.pdf
Global Annual PV Market http://www.epia.org/fileadmin/EPIA_docs/publications/epia/Global_Market_Outlook_Until_2013.pdf
Solar Cell Market Estimate -- First Generation -- -- Second Generation -- - Third Gen - SEMI PV Group March 2009 from source Yole Development
Global Annual PV Market Outlook http://www.epia.org/fileadmin/EPIA_docs/publications/epia/Global_Market_Outlook_Until_2013.pdf
Solar PV Market Outlook by 2030 8.9% of Global Energy, 1,864 GW Production Capacity, 2,646 TWh Electricity SEMI PV Group March 2009 from source EPIA Solar Generation V Sept 08 www.epia.org
Cost Projections $/kWh “Grid parity’ where PV cost are equal to residential electricity costs is expected to be achieved first in southern European countries and then to move north $1.35 $1.07 $0.81 $0.54 $0.27 $0.13 --- www.epia.org EPIA Solar Generation V Report Sept 08
Cumulative installed solar electric power by 2007 • 1st Germany 3.8 GW • 2nd Japan 1.9 GW • 3rd US 814 MW • 4th Spain 632 MW
1] World's largest photovoltaic (PV) power plants (12 MW or larger) http://en.wikipedia.org/wiki/Photovoltaic_power_stations
Large systems in planning or under construction • * Under construction; ** Proposed http://en.wikipedia.org/wiki/Photovoltaic_power_stations
Spain • Blessed with almost year-round sunshine, Spain's socialist government is trying to capitalize on this natural resource. • In an effort to encourage private individuals and companies to install solar power, Spain introduced subsidies of €0.42 per kilowatt per hour ($0.57/KWhr) (‘feed-in’ tariff and off-grid subsidies) • But the Spanish government is considering reducing this subsidy in September, a move which is likely to face opposition from within the solar energy industry. • 2007: 26,800 employees in Spanish solar companies http://www.guardian.co.uk/environment/2008/jul/09/solarpower.renewableenergy 9 July 2008 www.epia.org Solar Generation V Report Sep 2008
Olmedilla Solar Park 60 MWp photovoltaic park installed by Nobesol with modules from Silikin http://www.siliken.com/clientes_proyectos/instalaciones/ficha?contentId=572
Germany • 10,000 companies, including installers work in solar PV • 80 companies are cell and module makers • 42,000 employees • Sales were $5.7 B including $2.5 B in exports The ‘feed-in’ tariff • 2008 German utilities pay $0.47 to $0.68/kWh depending on type and size of system for new solar systems • Utilities pass cost to consumers – Germany average is $1.65/month www.epia.org Solar Generation V Report Sep 2008
Waldpolenz Solar Park • The Waldpolenz Solar Park is built on a surface area equivalent to 200 soccer fields, the solar park will be capable of feeding 40 megawatts into the power grid when fully operational in 2009. • In the start-up phase, the 130-million-euro ($201 million) plant it will have a capacity of 24 megawatts, according to the Juwi group, which operates the installation. • The facility, located east of Leipzig, uses state-of-the-art, thin-film technology. Some 550,000 thin-film modules will be used, of which 350,000 have already been installed. The direct current produced in the PV solar modules will be converted into alternating current and fed completely into the power grid. • After just a year the solar power station will have produced the energy needed to build it, according to the Juwi group. http://www.dw-world.de/dw/article/0,2144,3430319,00.html
Waldpolenz Solar Park http://www.dw-world.de/dw/article/0,2144,3430319,00.html
Waldpolenz Solar Park http://lumbergusa.com/main/Bild/sp_pv_07/Brandis-Waldpolenz-Fotomont.jpg
United States • 2007 - PV production grew in all areas of US market • US leads development of thin-film technology accounting for nearly half the global production • 2007 – about 50,000 employees • CA dominates with 60% of installed capacity • Various state Renewable Portfolio Standards (RPS) and Federal Investment Tax Credits (ITC) are incentives. • Solar America Initiative making progress on goal to bring PV costs to grid parity by 2015 www.epia.org Solar Generation V Report Sep 2008
Renewable Energy Consumption in the US Energy Supply, 2007 http://www.eia.doe.gov/cneaf/solar.renewables/page/trends/highlight1.html
Chart Data http://www.eia.doe.gov/cneaf/solar.renewables/page/trends/figure1_1.xls
US Solar Industry Data Solar energy represents less than 1% of the U.S. energy mix. However, as a result of growing awareness about reliable, off-the-shelf technology, concerns about rising costs, energy security and supplies, and new state and federal incentives, deployment of solar energy has exploded since 2005. • Size of U.S. Market2008 - U.S. had about 8,800 megawatts (MW) of installed solar capacity. 1,100 MW of photovoltaics (PV), 418 MW of utility-scale concentrating solar power, 485 MWTh (megawatts thermal equivalent) of solar water heating systems 7,000 MWTh of solar pool heating systems. • Ranking of U.S. Market: Cumulative installed solar electric power by 2007. 1st Germany 3.8 GW, 2nd Japan 1.9 GW, 3rd US 814 MW, 4th Spain 632 MW • Growth of U.S. Market 2008 - more than 18,000 individual PV systems were installed. Totaled 342 MW: 292 MW was grid-connected. • Growth of U.S. Manufacturing 2008 domestic PV cell manufacturing capacity grew 65 percent to 685 MW and production grew 53 percent to 414 MW. (Results preliminary) (Source: Greentech Media Research and the Prometheus Institute) www.seia.org/cs/about_solar_energy/industry_data and www.epia.org Solar Generation V Report Sep 2008
Nellis AFB Solar panels http://en.wikipedia.org/wiki/File:Nellis_AFB_Solar_panels.jpg
GM installs world's biggest rooftop solar panels • The largest rooftop solar power station in the world is being built in Spain. With a capacity of 12 MW of power, the station is made up of 85,000 lightweight panels covering an area of two million SqFt. • Manufactured in rolls, rather like carpet, the photovoltaic panels are to be installed on the roof of a General Motors car factory in Zaragoza, Spain. • General Motors, which plans to install solar panels at another 11 plants across Europe, unveiled the €50M ($68M) project yesterday. The power station should be producing energy by September. • The panels will produce an expected annual output of 15.1 million kilowatt hours (kWh) - enough to meet the needs of 4,600 households with an average consumption of 3,300kWh, or power a third of the GM factory. The solar energy produced should cut CO2 emissions by 6,700 tons a year. • Energy Conversion Devices who makes the panels, said it would be the largest rooftop solar array in the world. http://www.guardian.co.uk/environment/2008/jul/09/solarpower.renewableenergy 9 July 2008
GM installs world's biggest rooftop solar panels http://www.guardian.co.uk/environment/2008/jul/09/solarpower.renewableenergy 9 July 2008
Japan • 2002 - Basic Act on Energy Policy to secure stable energy supply, environmental suitability and use of market mechanisms • By 2006, installed 1.2 GW for 350,000 homes • 2008 – New research initiative to improve yields from 10-15% to 40% and reduce cost from $0.48/kWh to $0.073/kWh www.epia.org Solar Generation V Report Sep 2008
China • 2007 • National Renewable Energy targets • 10% by 2010 (300 MW) • 15% by 2020 (1.8 GW) • Supplies 1,130 tons of polysilicon from 6 companies • Supplies 21,400 tons of silicon ingot from 70 companies • Number 1 PV panel producer – 1.1 GW • 50 PV panel companies including Suntech, Yingli, Hebei Jingao, Jiansu Linyang, and Nangjing CEEG • 82,800 employees (6 times that of 2005) www.epia.org Solar Generation V Report Sep 2008
Top 10 PV Cell Producers Until recently BP Solar was dominant supplier. New Top 10 produce 53% of world total Q-Cells, SolarWorld - Germany Sharp, Kyocera, Sharp, Sanyo – Japan Suntech, Yingli, JA Solar – China Motech - Taiwan
BP Solar • BP Solar to supply PV power systems for Wal-Mart in CA 22 April 2009 • Under a power purchase agreement (PPA), BP will finance, install and maintain the systems and Wal-Mart will have immediate access to clean electricity with no up front capital cost to the retailer. • Will initially build 10 to 20 rooftop systems at Wal-Mart locations in California, and would work with the retailer to evaluate the potential for additional projects. Expects to complete the first set, 10 MW of installed solar power, within about 18 months. • 2008 BP completed 4.1 MW solar systems for 7 Wal-Marts & Sam’s Clubs in CA. • Since 1998, BP guarantees its modules for 25 years. • BP Solar, part of BP Alternative Energy, is a global company with about 2000 employees. With over 35 years of experience and installations in most countries, BP Solar is one of the world's leading solar companies. • BP is one of the world’s largest energy companies, in more than 100 countries and over 96,000 employees. http://www.bp.com/sectiongenericarticle.do?categoryId=9025044&contentId=7046577
BP axes 620 jobs from solar business • 01 April, 2009 - BP to axe 620 jobs from its solar power business – more than a quarter of that workforce – in a move it said was part of the long-term strategy to "reduce the cost of solar power to that of conventional electricity.“ • Two cell manufacture and module assembly plants near Madrid, will be shut with the loss of 480 posts while module assembly will also be phased out at its Frederick facility in Maryland, US, with a further 140 redundancies. • BP blamed the cutbacks on the credit crunch and lower-cost competition saying its global manufacturing capacity would still increase during this year and next via a series of strategic alliances with other companies. http://www.guardian.co.uk/environment/2009/apr/01/bp-solar
Q Cells SE • 1999 founded, 2001 began with the production of silicon solar cells with 19 employees. • By 2009, 2,600 employees (2007, 1700 employees) • Now the largest solar cell manufacturer in the world. (since 2007) • Continue to expand production in Bitterfeld-Wolfen, Germany and start construction of new Malaysian production facility. • Alongside the monocrystalline and polycrystalline (90% of business) core business, we use a wide range of technologies to develop and produce thin-film modules. (thin-film - 25% share of smaller market) • 2008 Sales $1.69 B 2007 Sales $1.16 B profitable • QCE: Frankfurt exchange http://www.q-cells.com/en and http://www.google.com/finance?q=FRA%3AQCE
Sharp Solar • Subsidiary of Sharp Electronics, Osaka, Japan • Produces silicon solar cells and thin film, leveraging silicon knowledge from LCD manufacturing • 2008, capacity will reach 1.6 million square meters of thin-film modules, as we simultaneously build the world's largest thin film manufacturing complex, capable of 10 million square meters per year. And this gigawatt-scale factory is only the first to come. Katsuga City, Nara and Sakai City, Osaka, Japan • Thin film efficiency 9%, expecting 10% from GW factory line. • Sharp powers more homes and businesses than any other solar mfg in the world. First mfgr to reach 2 GW cumulative production since mass production start in 1963 • Memphis, TN – 100 MW manufacturing facility http://solar.sharpusa.com/solar/solar_thin_film/1,,3-6,00.html and http://www.sharpusa.com/files/sol_dow_ThinFilm_101408.pdf
SunTech Power • BEIJING, Jan 12, 2009 (Xinhua via COMTEX) • China’s solar product maker SunTech Power Holdings Co., Ltd. (STP.NYSE) recently laid off 800 workers or 10 percent of its total employees and postponed its previous plan on recruiting 2,000 people, said Shi Zhengrong, chairman and CEO. • SunTech delayed plan to expand production capacity to 1.5 GW in 2009, which requires 2,000 more employees. • Plants in Wuxi and other areas are in normal operation with more than 50% capacity running, compared with 85% prior to financial meltdown. • SunTech has received more than 800 MW of orders in 2009 including 650 MW from Europe. 2008 overall orders of 500 MW. http://www.tradingmarkets.com/.site/news/Stock%20News/2119252/
SunTech Power • Sales $1.9B 2008, 1.3B 2007 profitable • Employees: 6784 • STP:NYSE • Wuxi, China • Worlds largest silicon cell maker • Average conversion efficiency rates of their monocrystalline and multicrystalline silicon PV cells 16.4% and 14.9% respectively • 10 May 2009 announces plan to build manufacturing plant in US, now shopping states for incentives http://www.google.com/finance?q=NYSE:STP
Kyocera Solar • US Solar Division – Scottsdale, AZ • Subsidiary of Kyocera, Kyoto, Japan (KYO:NYSE) $13B 2008 • 2008 broke ground for new plant in Tianjin City, China to expand there from 60 MW to 240 MW by 2011. First one in China ‘03 • 2012 total production capacity to be 650 MW from Japan, Mexico, the Czech Republic and Tianjin. • Technology built on knowledge of fine ceramics, with metals, plastics, and electronics developed for copiers and printers http://www.kyocerasolar.com/about/