Download
1 / 16
170 likes | 625 Vues
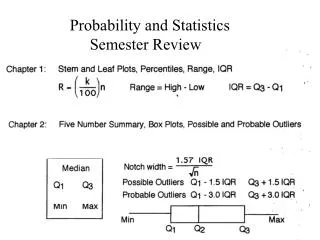
Mathematical Terms Related to a Group of Numbers. Data Collection Mean, Mode, Median, & Range Standard Deviation. Mean = the average. Consider your measurements as a set of numbers. Add together all the numbers in your set of measurements. Divide by the total number of values in the set

E N D
Mathematical Terms Related to a Group of Numbers Data CollectionMean, Mode, Median, & RangeStandard Deviation
Mean = the average • Consider your measurements as a set of numbers. • Add together all the numbers in your set of measurements. • Divide by the total number of values in the set Ages of cars in a parking lot: 20 years +10 years +10 years +1 year+15 years +10 years=66 years/6 cars = 11years (answer is a counted numbers for sig figs are not an issue) • Note: the mean can be misleading if there is one very high value and one very low, the average will be high)
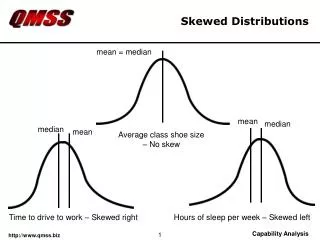
Median The number in the middle Put numbers in order from lowest to highest and find the number that is exactly in the middle 20, 15, 10, 10, 10, 1 Since there is an even number of values the median is 10 years (average of the 2 middle values)
Or to determine the Median: 20 years, 15 years, 13 years, 11 years, 7 years, 5 years, 3 years With an odd number of values the median is the number in the middle or 11 years
Mode • Number in data set that occurs most often 20, 15, 10, 10, 10, 1 • Sometimes there will not be a mode 20, 17, 15, 8, 3 Record answer as “none” or “no mode” – NOT “0” • Sometimes there will be more than one mode 20, 15, 15, 10, 10, 10, 1
Range The difference between the lowest and highest numbers 20, 15, 10, 10, 1 20-1 = 19 years The range tells you how spread out the data points are.
Example: 100% 78% 93% 84% 91% 100% 82% 79% 80% What is the mean? What is the median? What is the mode? What is the range?
Measured Values When making a set of repetitive measurements, the standard deviation (S.D.) can be determined to • indicate how much the samples differ from the mean • indicate also how spread out the values of the samples are
Standard Deviation • The smaller the standard deviation, the higher the quality of the measuring instrument and your technique • Also indicates that the data points are also fairly close together with a small value for the range. • Indicates that you did a good job of precision w/your measurements.
A high or large standard deviation • Indicates that the values or measurements are not similar • There is a high value for the range • Indicates a low level of precision (you didn’t make measurements that were close to the same) • The standard deviation will be “0” if all the values or measurements are the same.
Formula for Standard Deviation range (highest value – lowest value) N = number of measured values As N gets larger or the more samples (measurements, scores, etc.), the reliability of this approximation increases = =
Example 1 22.5 mL, 18.3 mL, 20.0 mL, 10.6 mL The Standard Deviation would be: range (highest value – lowest value) Range = 22.5 – 10.6g = 11.0 mL N = 4 11.0g = = 5.95 mL = = 6.0 mL S.D. = 17.9 ± 6.0 mL (expressed to the same level of precision as the mean)
Example 2 Age of cars: 15 years, 12 years, 12 years, 1 year, 14 years and 12 years What is the mean? What is the range? What is N ?
The Standard Deviation would be: range (highest value – lowest value) = = S.D. = 11 ± 6 years.
Expressing the S.D. S.D. represents the uncertainty of the last sig fig of the set of data Therefore the S.D. is expressed to the same level of precision as the mean value 234 (ones place) 17.9 (tenths place)
~Review~ • Mean – average • Mode – which one occurs most often • Median – number in the middle • Range – difference between the highest and lowest values • Standard Deviation – The standard deviation of a set of data measures how “spread out” the data set is. In other words, it tells you whether all the data items bunch around close to the mean or is they are “all over the place.”