Simulation
Learn how to simulate queuing systems with continuous variables for performance analysis and optimization. Understand various distributions and conversion techniques for accurate modeling.

Simulation
E N D
Presentation Transcript
Simulation Continuous Variables Dr. Satish Nargundkar
0 1 Distributions • Variables to be simulated may be normal (e.g. height) or exponential (e.g. service time) or various other distributions. • Task is to convert uniform distribution to the required distribution. Freq Freq 0 infinity Dr. Satish Nargundkar
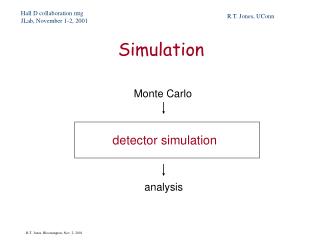
Application - Queuing Systems • A queuing system is any system where entities (people, trucks, jobs, etc.) wait in line for service (processing of some sort) – • retail checkout lines, jobs on a network server, phone switchboard, airport runways, etc. Dr. Satish Nargundkar
Queuing System Inputs • Queuing (waiting line) systems are characterized by: • Number of servers / number of queues • SSSQ – Single Server Single Queue • SSMQ – Single Server Multiple Queue • MSSQ – Multiple Server Single Queue • MSMQ - Multiple Server Multiple Queue • Arrival Rate (Arrival Intervals) • Service Rate (Service Times) Dr. Satish Nargundkar
Performance Variables (outcome) • Performance of a queuing system is measured by • Average time waiting in queue/system • Average number of entities in queue/system Time in Queue Service Time Arrival time Service Begins Service Ends Time in System Dr. Satish Nargundkar
Distributions in Queuing • Arrival Intervals (time between two consecutive arrivals) and Service Time (time to serve one customer) are exponentially distributed. • Confirm it yourself by watching cars on a street! Dr. Satish Nargundkar
Sample Problem • A loading dock (SSSQ) has trucks arriving every 36 minutes (0.6 hrs) on average, and the average service (loading / unloading) time is 30 minutes (0.5 hrs). A new conveyer belt system can reduce that to 15 minutes (0.25 hours). Simulate the arrival of 200 trucks to see how performance would be affected by the new system. Dr. Satish Nargundkar
Simulating Exponential Distributions • To convert the uniform distribution of the random numbers to an exponential distribution, take the negative natural log of the random numbers. • This creates an exponential distribution with an average of 1.00. • To get an average of 0.6 (to represent average arrival interval in hours), simply multiply result by 0.6. • Thus, the conversion formula is: –ln(rand())*µ where µis the mean of the exponential distribution desired. Dr. Satish Nargundkar
0 1 Sample Conversion Average: infinity 0 ….. ….. Dr. Satish Nargundkar