Download
1 / 32
320 likes | 341 Vues
Thinking Spatially w ith Maps DeMers: Chapter 3. The map is the fundamental device by which we abstract our environment’s space, and within which the GIS will operate to analyze it. Overview. Maps Shift in Cartography Scales Projections Grid systems for mapping The cartographic process

E N D
Thinking Spatially with Maps DeMers: Chapter 3 The map is the fundamental device by which we abstract our environment’s space, and within which the GIS will operate to analyze it.
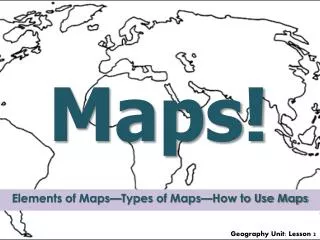
Overview • Maps • Shift in Cartography • Scales • Projections • Grid systems for mapping • The cartographic process • Symbols • Some problems related to specific thematic maps
Important considerations: • The cartographic method • How do we depict spatial features and their relationships? • How do we portray a 3D world in 2D?
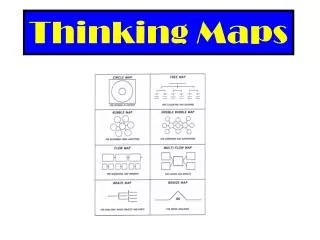
Maps • Maps are a graphic form of spatial data • Map as Model: The Abstraction of Reality a map is an abstraction of reality not meant to show every detail implies selective inclusion/exclusion of objects and phenomena (as well as their attributes) • Types: • Reference • Thematic
3. Shift in Cartography • Communication paradigm • Assumed that the map itself was a final product designed to communicate spatial pattern through the use of symbols, class limit selection, and so on. E.g. Tourism maps • Map is end result and the user is incapable of regrouping the data into forms more useful • Analytical (holistic) paradigm • Maintains the raw attribute data inside a computer storage and displays data based on user needs and classification • The map allow for both communication and analysis
Scale: The ratio of distance on the map to the same distance as it appears on the earth 4. Illustrating scale
Effect of scale on accuracy The rule of thumb: It is always better to reduce a map after analysis than to enlarge it for analysis
5.Map Projections • 3D Earth -> -> 2D surface? • Families of projections • Distortions (shape, distance, direction, area)
Definition • Map projections are attempts to portray the surface of the earth or a portion of the earth on a flat surface. Some distortions of conformality, distance, direction, scale, and area always result from this process. • Some projections minimize distortions in some of these properties at the expense of maximizing errors in others. Some projection are attempts to only moderately distort all of these properties
Classes of map projections • Cylindrical:Result from projecting a spherical surface onto a cylinder.When the cylinder is tangent to the sphere contact is along a great circle (by a plane passing through the center of the Earth). • Conic:Result from projecting a spherical surface onto a cone. When the cone is tangent to the sphere contact is along a small circle. • Azimuthal:Result from projecting a spherical surface onto a plane.When the plane is tangent to the sphere contact is at a single point on the surface of the Earth.
Classes of map projections-continue • Miscellaneous projections: Include unprojected ones such as rectangular latitude and longitude grids and other examples of that do not fall into the cylindrical, conic, or azimuthal categories
Historically - light source projected features on a transparent globe Three families of map projections (a) Flat surfaces (b) Cylinders (c) Cones
Distortions • When projecting from 3D sphere to 2D globe, there will be some distortions in shape, distance, direction, area • Conformal or orthomorphic map projection: When the scale of a map at any point on the map is the same in any direction, the projection is conformal. Meridians (lines of longitude) and parallels (lines of latitude) intersect at right angles. Shape is preserved locally on conformal maps. • It retains the property of angular conformity, but results in distortion of areas
Distortions-continue • Equal area or equivalent projections: Preserves areas, but distorted angles, i.e. areas and angles cannot be preserved at the same time • Equidistant projections: Preserves distance along standard parallels or from one or two points • Azimuthal projection: A map preserves direction when azimuths (angles from a point on a line to another point) are portrayed correctly in all directions (navigation)
Selection of a projection • The first step in choosing a projection is to determine: Location, Size, and Shape • These three things determine where the area to be mapped falls in relation to the distortion pattern of any projection. One "traditional" rule says: • A country in the tropics asks for a cylindrical projection. • A country in the temperate zone asks for a conical projection. • A polar area asks for an azimuthal projection.
Selection of a projection-continue • Implicit in these rules of thumb is the fact that these global zones map into the areas in each projection where distortion is lowest: • Cylindricals are true at the equator and distortion increases toward the poles. • Conics are true along some parallel somewhere between the equator and a pole and distortion increases away from this standard. • Azimuthals are true only at their center point, but generally distortion is worst at the edge of the map.
6. Grid systems for mapping • Need a grid (coordinate system) for distance and direction on the earth. • Also need grid system that take into account the distortions introduced by projecting world onto 2D map. • Rectangular coordinates (plane coordinates) • Basic Cartesian coordinate system (x,y) • Plane coordinate system are used to represent large areas and not small scale maps. For small scale maps, adjustment must be made to compensate for the distortions. • The Universal Transverse Mercator (UTM) is the most prevalent plane grid system used in GIS operations
A cartesian coordinate system (X,Y) (N,E) Digitizers are based on cartesian coordinate system
The Universal Transverse Mercator (UTM) • UTM system is used to define horizontal, positions world-wide by dividing the surface of the Earth into 6 degree zones, each mapped by the Transverse Mercator projection with a central meridian in the center of the zone. UTM zone numbers designate 6 degree longitudinal strips extending (60 zones) from 80 degrees South latitude to 84 degrees North latitude. The zones numbering starts at 180th meridian in east ward direction • Eastings are measured from the central meridian (with a 500km false easting to insure positive coordinates). Northings are measured from the equator (with a 10,000km false northing for positions south of the equator).
The cartographic process • The main four general steps in cartographic process are: • Data collection: Field survey • Data compilation: Development of base map • Map production: Output of a map with all features • Map reproduction: Quantitative production at different scales (Magnification, reduction) • Although the analytical or holistic paradigm may not follow the same steps, the process is almost similar
Map symbolism • Geographic objects (point, line, area, surface) are represented by symbols on the map • Symbol geometry and dimensionality are sometimes not a true representation of an object, but are often manipulated to achieve a particular visual response (e.g. area symbol represent a point feature) • A major difference between communication and holistic paradigms is the classification-oriented manipulation of data prior to map production (Class interval selection-see Chap9)
Class interval selection methods • Constant interval: Same number of areas/data in each category/class (contour interval) • Variable intervals: Isolating certain high or low values, for highlighting variations in value (Creating a discrete set of point symbols to show variation in attribute variable) • Considerations must be paid, during the input to GIS, to symbols, method of classification, and graphic simplification (if road, river, and railway are very near, they can be displaced from their original location to improve visualization) (feature elimination (filtering) and smoothing:rivers-roads)
Map abstraction and cartographic database • Cartographic database are collected from existing cartographic documents, which may include some filtering and smoothing of spatial feature, therefore the GIS input will not be accurate • Geographic database are collected from field (surveying, GPS) or remotely sensed data, which are more accurate and sometimes the GIS input device (scanner, digitizer) may not give the same accuracy • Incompatibility between maps generated from different sources or scale may arise in GIS • The scale of input for a cartographic database should be as nearly identical as possible
Some problems related to specific thematic maps • Soil maps: Provide information for agricultural activities. Problems associated with soil maps are method of sampling using aerial photographs (distortion, relief, projection- Orthophotomaps) • Zoological maps: Provide information about animal locations (point or area). Problems associated with these maps is the movement of animal, therefore time domain must be encounter • Remote sensing imagery:Geometry and manipulation (resolution,enhancement,classification) • Vegetation maps: Sampling and classifications • Historical maps: Use for spatiotemporal analysis, different tools for data collection and classification,
Questions 1. What is the difference between communication and holistic paradigms in cartography 2. How scale is illustrated on a map and the potential problems in analyses when scale is changed. 3. Briefly discuss the classes of map projections. 4. What basic properties of the spherical earth are affected by using map projection? 5. What are the factors that considered in selection of a projection
References • Anson, R. W., 1996. Basic Cartography for Students and Technician. Butterwork. • Clarke, K. C., 1990. Analytical and Computer Cartography, Prentice Hall, New York. • Maling, D.H. 1992. Co-ordinate Systems and Map Projections, 2nd Ed. Pergamon Press. Oxford. • Muehrcke, Phillip C. 1986. Map use: Reading, Analysis, Interpretation. Madison, WI: JP Publications. • Robinson, A. H., J. L. Morrison, P. C. Muehrcke, A. Jon Kimerling, and S. C. Guptil, 1995. Elements of Cartography, 6th ed., John Wiley & Sons, Inc., New York. (Very Important Reference). • Snyder, John P. 1987. Map Projections: a working Manual. USGS Professional Paper 1395. Washington, DC: United States Government Printing Office.