Evolution of PDF Fitting: From Assumptions to Reality (2008)
290 likes | 305 Vues
Explore progress in PDF fitting over 20 years, including developments in assumptions and model assumptions. Understand the evolution of u-quark appearances. Delve into the intricacies of charm sea generation and flavor structures.

Evolution of PDF Fitting: From Assumptions to Reality (2008)
E N D
Presentation Transcript
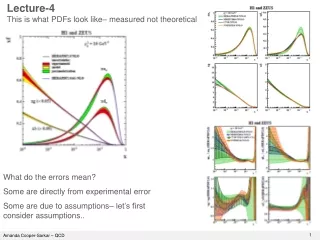
Lecture-4 This is what PDFs look like– measured not theoretical (2008) What do the errors mean? Some are directly from experimental error Some are due to assumptions– let’s first consider assumptions..
Progress made over 20 years of PDF fitting ( thanks to Wu-ki Tung)
The u-quark 1984 looks rather different than the u-quark 2004 Why? Obviously experiment has contributed HERA data has shown us that at low-x the gluon rises very steeply and generates a steep behaviour in the quarks.. (lecture 6) But there has also been development in relaxing assumptions
Model Assumptions • The mathematical form of the parameterisation • (The NNPDF use a neural net to learn the shape of the data rather than imposing a specific form of parameterisation) • For Q2 >> Q02 this gets “washed out” provided it’s reasonable… • Value of Q02 • No longer assume: • , as in early work • independent of x, bu = bd • Or • Or impose values on these parameters like • Where did these prejudices from? • - Regge theory and counting rules
We now know that, Rather than (ubar+dbar)/2 (from neutrino dimuons – maybe!) • Charm sea generated by Boson Gluon Fusion (BGF) • We still assume: • dproton = uneutron • uproton = dneutron MRST QED 2004 challenges this Maybe not for strange sector?
Flavour structure Historically an SU(3) symmetric sea was assumed u=uv+usea, d=dv+dsea usea= ubar = dsea = dbar = s = sbar =K and c=cbar=0 Measurements of F2μn = uv + 4dv +4/3K F2μp 4uv+ dv +4/3K Establish no valence quarks at small-x because F2μn/F2μp →1 But F2μn/F2μp →1/4 as x → 1 Not to 2/3 as it would for dv/uv=1/2, hence it look s as if dv/uv →0 as x →1 i.e the dv momentum distribution is softer than that of uv- Why? Non-perturbative physics --diquark structures? How accurate is this? Could dv/uv →1/4 (Farrar and Jackson)?
Since we are in Jlab I should devote a little more time to this. The d-quark is often determined from deuterium targets by using the assumption d in proton = u in neutron (u’s have larger charge-larger coupling). But that is not the most dramatic assumption. You have to know the corrections from bound deuterium to a (p+n)/2 isoscalar target CJ PDFs relax the cuts usually made on low-Q2 /high-x data which exclude the region sensitive to higher twists, target mass corrections, deuterium corrections and then make estimates of these corrections. The improvement in statistics at high-x more than compensates for the uncertainty on these corrections. More recent CJ15 analysis has used new data from Tevatron lepton asymmetry data And Jlab data from BONuS on F2n/F2D
Flavour structure in the sea dbar in the sea Consider the Gottfried sum-rule (at LO) ∫ dx (F2p-F2n) = 1/3 ∫dx (uv-dv) +2/3∫dx(ubar-dbar) If ubar= then the sum should be 0.33 the measured value from NMC = 0.235 ± 0.026 Clearly dbar …why? low Q2 non-perturbative effects, Pauli blocking, p →nπ+,pπ0,Δ++π- Shape information comes from Drell-Yan data pp and pD m- n sbar≠(ubar in fact sbar ~ (ubar+ (MAYBE!) Why? The mass of the strange quark is larger than that of the light quarks Evidence – neutrino opposite sign dimuon production rates And even s≠sb ? Because of p→ΛK+ W+ c→s μ+ s
What is the ratio of the strange parton distribution to the light quark PDFs? μ- ν W+ s s c μ+ ν Nobody really knows. It appears suppressed at high-x , x> 0.05 But not necessarily at lower x We had a traditional view that rs(x)=sbar/dbar ~0.5. Why? Because of neutrino opposite-sign dimuon data (NuTeV, now CHORUS, NOMAD) But this has been fed into fits CT, NNPDF, MMHT and look at the large discrepancies! The neutrino only provides any information for x~0.1, plus it needs nuclear target corrections, plus it needs understanding of the s →c threshold transition- and of the progress of the charm particle through the nuclear medium
BUT Is the strangeness sector even charge symmetric?- is this the cause of the NuTeV sin2θW anomaly? s-(x) x s-(x) • CTEQ say that current global analysis does not require a non-zero xs-(x)= x(s-sbar) Its value is in the range At 90%CL They also give a range of possible shapes. . MRST say there is an asymmetry <xs-(x)> =0.0028±0.0012 • But this is a very small effect
Is it true that u in proton = d in neutronNOT if QED corrections are incorporated in the analysis- is this the cause of the NuTeV sin2θW anomaly? • And this is an even smaller effect
Heavy quark treatment – illustrate with charm Massive quarks introduce another scale into the process, the approximation mq2~0 cannot be used Zero Mass Variable Flavour Number Schemes (ZMVFNs) traditional c=0 until Q2 ~4mc2, then charm quark is generated by g→ c cbar splitting and treated as massless-- disadvantage incorrect to ignore mc near threshold Fixed Flavour Number Schemes (FFNs) If W2 > 4mc2 then c cbar can be produced by boson-gluon fusion and this can be properly calculated - disadvantage ln(Q2/mc2) terms in the cross-section can become large- charm is never considered part of the proton however high the scale is. General Mass variable Flavour Schemes (GMVFNs) Combine correct threshold treatment with resummation of ln(Q2/mc2) terms into the definition of a charm quark density at large Q2 Arguments as to correct implementation but should look like FFN at low scale and like ZMVFN at high scale. Additional complications for W exchange s→c threshold.
Heavy quarks Heavy quark distributions in fits are dynamically generated from g→c cbar Results dependon the “scheme” chosen to handle heavy quark effects in pQCD–fixed-flavor-number (FFN) vs. variable-flavor-number (VFN) schemes – this has got worse lately ! There is more disagreement as more groups jump into the game. Going to NNLO should help
We’ve got a long way in agreeing on reasonable model assumptions But there is still room for choice: • Values of heavy quark masses– and even the heavy quark scheme • Value of αS(MZ2) – or determine it in the fit • Values of Q20 • Values of Q2min of the data – include low Q2, low W2 data or not? • The data sets included • Form of the parameterisation And there is also the matter of how you treat the experimental errors..
The PDF fit results in a set of parameters p with errors. Now let’s talk about the experimental errors. The PDF shapes are functions F of these parameters so the errors on the PDFs: • The cross sections / structure functions are more complex functions of the PDFs and their errors can be similarly evaluated. • Two points: • PDF groups diagonaliseVjk and refer to PDF eigenvectors – which are just suitable combinations of parameters, • Or you can use the asymmetric version adding up +ve and –ve deviations from the central predictions in quadrature separately – better when errors are non-Gaussian • For 68% CL error bands you would think that the tolerance ,T=1, and similarly for 90%, T=2.73, but this is NOT so for MSTW2008 or CTEQ6.6
.Some data sets incompatible/only marginally compatible? To illustrate: the χ2 for the MRST global fit is plotted versus the variation of a particular parameter (αs ). The individual χ2e for each experiment is also plotted versus this parameter in the neighbourhood of the global minimum. Each experiment favours a different value of. αs PDF fitting is a compromise. Can one evaluate acceptable ranges of the parameter value with respect to the individual experiments?
How far away from the central fit can you go and still fit each data set within 90% (or 68%) CL? Tolerance No further than this HI/Zeus data determine the limit on the eigenvector E866/NuTeV data determine the limit on this one
Summary of which eigenvectors are determined by which data sets. 68% CL has a tolerance T = 4 – 5 90% CL has a tolerance T = 7 – 8 Which means Δx2 = 20 - 68% = 50 - 90% Relax, you can use the PDF sets in LHA PDF as a “black box” – it is all done for you.
Now let’s consider the measurement of αS(MZ2) and the gluon PDF • Ways to measure αS(MZ2): • For non-singlet (valence) quark distributions, There is no contribution to evolution from the gluon. • Thus the evolution of a non-singlet structure function, • Like xF3in ν, νN • or xF3in e±pat high Q2 via Z0exchange • Can directly measure αS with the smallest number of assumptions. • Unfortunately it also has the largest experimental difficulty
More usually the scaling violations of the singlet structure function have to be used so that the determination of αS(MZ2) is coupled to the gluon shape determination. • Increasing αS increases the negative contribution from Pqq term, but this can be compensated by the positive contribution from Pqg term if the gluon is made harder. • αS(MZ2) increases → gluon harder • So, αS(MZ2) = 0.115 and • may give a similar χ2 to • αS(MZ2) = 0.118 and αS is determined in the same global fits which determine PDF parameters → Fortunately there are now so many data points now that there are limits to this freedom.
Many PDFs use a fixed value of αS(MZ) (CTEQ, NNPDF, HERAPDF,.. Look what happens when you free it..
Jet studies in the Hadron Final state gives us more information • You can measure αS(Q2) and xg(x,Q2) from 2+1 jet events QCDC BGF xg xq +1 means proton remnant σ2+1 ~ αS{A xg g(xg,Q2) + B xgq(xq,Q2)} This helps to break the αS(Q2) / gluon PDF correlation Use more information that depends directly on the gluon -- jet cross-sections (glue) + (quark) • To get αS(Q2) • Choose kinematic region where PDFs xq(x), x g(x) are well known. (i.e. xg > 10-2, xq > 10-3 – 10-2 and σBGF ~ σQCDC • To get x g(x,Q2) • Assume αS is known • Choose kinematic region BGF > QCDC (i.e. low x, Q2) In practice we fit jets in all kinematic regions and hope to determine xg(x,Q2) and αS(Q2) simultaneously
Look what happens when you keep αS(MZ) free but add jets.
And look what happens to your ability to determine αS(MZ) αS(MZ)=0.1183 ± 0.0009 (exp) ± 0.0005(model/param) ± 0.0012(hadronisation) BUT beware NLO scale uncertainties +/- 0.003 or so
So we have a prediction F2 QCD for a particular x, Q2 F2lp made up for evolved singlet + non-singlet densities and we have a measurement F2meas We perform χ2 fitting Traditionally, iare ~1500 x, Q2 points Good χ2 → theoretical picture is valid → determines ~ 15 parameters (note αs may also be a parameter) → errors on these parameters can also be propagated back to give errors on parton distributions + predictions of structure functions, cross sections etc. not yet measured. Not good enough! What about correlated systematic errors?
Correlated errors • Normalisations → all points move up or down together • More subtle. e.g. calorimeter energy scale moves events between x, Q2 bins • → correlations change the shape of the function Δiλsys is the correlated systematic error on point i due to source λ i.e. the prediction is modified by each source of systematic uncertainty. sλ are fit parameters which have zero mean and unit variance if all systematics have been estimated correctly.
For each eigenvector parameter they consider how well fit is each contributing to the data set
HERA-II and Tevatron Run-II have improved our knowledge Example- decrease in gluon PDF uncertainty from using ZEUS jet data in ZEUS PDF fit. Direct* Measurement of the Gluon Distribution ZEUS jet data much more accurate than Tevatron jet data- small energy scale uncertainties