TOPIC 11 MEASUREMENT AND DATA PROCESSING
11.1 UNCERTAINTIES AND ERRORS IN MEASUREMENT AND RESULTS. TOPIC 11 MEASUREMENT AND DATA PROCESSING. By: Merinda Sautel Alameda Int’l Jr/Sr High School Lakewood, CO msautel@jeffco.k12.co.us. ESSENTIAL IDEA.

TOPIC 11 MEASUREMENT AND DATA PROCESSING
E N D
Presentation Transcript
11.1 UNCERTAINTIES AND ERRORS IN MEASUREMENT AND RESULTS TOPIC 11MEASUREMENT AND DATA PROCESSING By: Merinda Sautel Alameda Int’l Jr/Sr High School Lakewood, CO msautel@jeffco.k12.co.us
ESSENTIAL IDEA All measurement has a limit of precision and accuracy, and this must be taken into account when evaluating experimental results. NATURE OF SCIENCE (3.2,3.4) Making quantitative measurements with replicates to ensure reliability—precision, accuracy, systematic, and random errors must be interpreted through replication.
INTERNATIONAL-MINDEDNESS As a result of collaboration between seven international organizations, including IUPAC, the International Standards Organization (ISO) published the Guide to the Expression of Uncertainty in Measurement in 1995. This has been widely adopted in most countries and has been translated into several languages.
THEORY OF KNOWLEDGE Science has been described as a self-correcting and communal public endeavor. To what extent do these characteristics also apply to the other areas of knowledge?
UNDERSTANDING/KEY IDEA 11.1.A Qualitative data includes all non-numerical information obtained from observations not from measurement.
UNDERSTANDING/KEY IDEA 11.1.B Quantitative data are obtained from measurements, and are always associated with random errors/uncertainties, determined by the apparatus, and by human limitations such as reaction times.
UNDERSTANDING/KEY IDEA 11.1.C Propagation of random errors in data processing shows the impact of the uncertainties on the final result.
UNDERSTANDING/KEY IDEA 11.1.D Experimental design and procedure usually lead to systematic errors in measurement, which cause a deviation in a particular direction.
UNDERSTANDING/KEY IDEA 11.1.E Repeat trials and measurements will reduce random errors but not systematic errors.
APPLICATION/SKILLS Be able to distinguish between random errors and systematic errors.
APPLICATION/SKILLS Record uncertainties in all measurements as a range (+/-) to an appropriate precision.
APPLICATION/SKILLS Be able to discuss ways to reduce uncertainties in an experiment.
APPLICATION/SKILLS Be able to propagate uncertainties in processed data, including the use of percentage uncertainties.
APPLICATION/SKILLS Be able to discuss systematic errors in all experimental work, their impact on the results and how they can be reduced.
APPLICATION/SKILLS Be able to estimate whether a particular source of error is likely to have a major or minor effect on the final result.
APPLICATION/SKILLS Be able to calculate percentage error when the experimental result can be compared with a theoretical or accepted result.
APPLICATION/SKILLS Know the distinction between accuracy and precision in evaluating results.
GUIDANCE The number of significant figures in a result is based on the figures given in the data. When adding or subtracting, the final answer should be given to the least number of decimal places. When multiplying or dividing the final answer is given to the least number of significant figures.
GUIDANCE Note that the data value must be recorded to the same precision as the random error.
GUIDANCE SI units should be used throughout the programme.
11.1.1 Describe and give examples of random uncertainties and systematic errors.
In the laboratory, no measurement is exact. • There are three types of error: • Human error (not acceptable as experimental error and should not be included in the report) • Random error • Systematic error
SYSTEMATIC ERROR • An error caused by the result of poor experimental design which causes the result to be skewed in the same direction every time. • Fixed by better equipment and better experimental design • Cannot be reduced by repeating the experiment • Examples • Heat loss in an exothermic reaction • Reading from the top of the meniscus • Overshooting the endpoint in a titration • Mis-calibrated thermometer • A cloth tape measure that has been stretched out.
RANDOM ERROR (uncertainty) • An error that has an equal probability of being too high or too low. • Can be reduced by repeated measurements • Examples • Fluctuations in the balance • Changes in the surrounding environment such as temperature variations and air currents • Misinterpreting the reading • Using a stopwatch to time a reaction • Insufficient data • Judging a color change
MORE ON RANDOM ERRORS The random error is equivalent to the uncertainty in the measurement. When the final uncertainty from random errors is calculated, it is then compared to the percent error. If the % error is smaller than the % uncertainty, the difference is due to random errors. If the % error is larger than the % uncertainty, then random errors alone do not explain the discrepancy and systematic errors must be involved.
ERROR DISCUSSION All experimental conclusions must take into account any systematic errors and random uncertainties. You should recognize that if one measurement has a much greater uncertainty than other measurements, then this will have the largest effect on the uncertainty of the final result. Be sure to evaluate experimental procedure to discuss how to reduce systematic errors.
11.1.2 Distinguish between precision and accuracy.
ACCURACY Accuracy is how close you are to the true value. Accurate measurements have small systematic errors and give a result close to the accepted value.
PRECISION Precision refers to the repeatability of a measurement. Precise measurements have small random errors and are reproducible in repeated trials. Precision also indicates how many significant figures there are in the measurement.
11.1.3 Describe how the effects of random uncertainties may be reduced.
Random uncertainties are reduced by doing repeated measurements.
11.1.4 State random uncertainty as an uncertainty range (+/-).
DIGITAL UNCERTAINTIES The uncertainty of a digital instrument is written by +/- the smallest scale. A balance that reads to 2 decimal places has an uncertainty of (+/- .01). A thermometer that reads to 1 decimal place has an uncertainty of (+/- .1).
ANALOGUE UNCERTAINTIES Non digital devices have uncertainties of +/- half of the smallest division. An alcohol thermometer with the smallest division of 1 degree Celsius would have an uncertainty of (+/- .5). A graduated cylinder with a smallest division of 2 mL would have an uncertainty of (+/- 1 mL). A ruler with 1mm divisions is (+/- .05cm).
11.1.5 State the results of calculations to the appropriate number of significant figures.
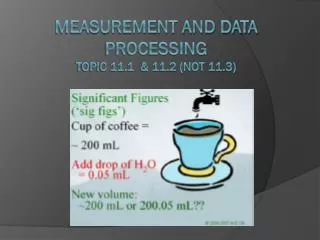
SIGNIFICANT FIGURES • REVIEW • Adding/subtracting: answer matches least number of decimal places • Multiplying/dividing: answer matches least number of sig figs (least precise value) • All of your data MUST be recorded with the correct number of sig figs. • If your uncertainty is 15.00 +/- .01, then you may not record the data as 15.1.
Citations International Baccalaureate Organization. Chemistry Guide, First assessment 2016. Updated 2015. Brown, Catrin, and Mike Ford. Higher Level Chemistry. 2nd ed. N.p.: Pearson Baccalaureate, 2014. Print. ISBN 978 1 447 95975 5 eBook 978 1 447 95976 2 Most of the information found in this power point comes directly from this textbook. The power point has been made to directly complement the Higher Level Chemistry textbook by Brown and Ford and is used for direct instructional purposes only.