UNIT 3 MEASUREMENT AND DATA PROCESSING
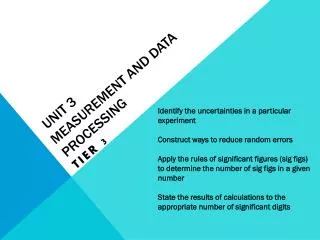
UNIT 3 MEASUREMENT AND DATA PROCESSING. TIER 1 & 2. TIER 1 LEARNING GOALS. TIER 1 Define random errors Define systematic errors Define absolute uncertainties Define percentage uncertainties Define precision Define accuracy Define significant figures Define bet fit line

UNIT 3 MEASUREMENT AND DATA PROCESSING
E N D
Presentation Transcript
UNIT 3 MEASUREMENT AND DATA PROCESSING TIER 1 & 2
TIER 1 LEARNING GOALS • TIER 1 • Define random errors • Define systematic errors • Define absolute uncertainties • Define percentage uncertainties • Define precision • Define accuracy • Define significant figures • Define bet fit line • Define independent variable • Define dependent variable • Define interpolate • Define extrapolate
RANDOM ERRORS - errors that has an equal probability of being too high or too low SYSTEMATIC ERRORS- errors that result from poor experimental design or procedures ABSOLUTE UNCERTAINTIES- is the size of the range of values in which the "true value" of the measurement probably lies. PERCENTAGE UNCERTAINTIES-interpreted as describing the uncertainty that would result if the measured value had been 100 units. It is calculated by dividing the absolute uncertainty by the measured value times 100.
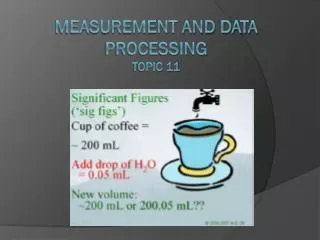
PRECISION-refers to the closeness of a set of measurements of the same quantity made in the same way ACCURACY- refers to the closeness of a set of measurements to the correct or accepted value of the quantity measured. SIGNIFICANT FIGURES-digits in a measurement up to and including the first uncertain digit
BET FIT LINE-line on a graph that passes as near to as many of the points as possible INDEPENDENT VARIABLE- the variable that is manipulated DEPENDENT VARIABLE-the variable that measured INTERPOLATE-estimating between points on a graph EXTRAPOLATE-estimating beyond points on a graph
EXTRAPOLATE INTERPOLATE
TIER 2 LEARNING GOALS • Illustrate examples of random errors Illustrate examples of systematic errors • Demonstrate the difference between precision and accuracy
RANDOM ERRORS THE READABILITY OF THE MEASURING INSTRUMENT THE EFFECTS OF CHANGES IN THE SURROUNDINGS SUCH AS TEMPERATURE VARIATIONS INSUFFICIENT DATA TINY VIBRATIONS, VOLTAGE FLUCTUATIONS AND AIR CURRENTS INTERFERING WITH MASS MEASUREMENTS
SYSTEMATIC ERRORS MEASURING THE VOLUME OF WATER FROM THE TOP OF THE MENISCUS OVERSHOOTING THE VOLUME OF A LIQUID DELIVERED IN A TITRATION HEAT LOSSES IN AN EXOTHERMIC REACTION NOT ZEROING THE BALANCE POOR LAB TECHNIQUES