Download
1 / 23
240 likes | 309 Vues
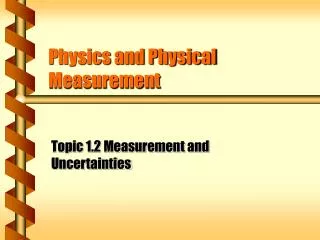
Topic 11: Measurement and Data Processing IB Core Objective 11.1.2 Distinguish between precision and accuracy . Distinguish : Give the differences between two or more different items. (Obj. 2). 11.1.2 Distinguish between precision and accuracy.

E N D
Topic 11: Measurement and Data Processing IB Core Objective 11.1.2 Distinguish between precision and accuracy. Distinguish: Give the differences between two or more different items. (Obj. 2)
11.1.2 Distinguish between precision and accuracy. Accuracy: How close you are to the true value Precision: How reproducible your measurements are.
11.1.2 Distinguish between precision and accuracy. Random Systematic (Not precise not accurate) (precise but not accurate) Good reading (precise and accurate)
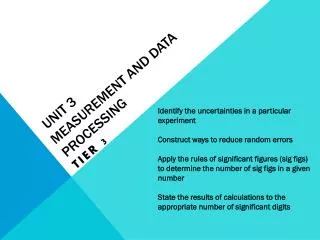
IB Core Objective 11.1.1 Describe and give examples of random uncertainties and systematic errors. Describe: Give a detailed account. (Obj. 2)
11.1.1 Describe and give examples of random uncertainties and systematic errors. Types of error: • Random error: Is caused by measurement estimation when reading equipment. If the measurements are inconsistent then the lab technique is poor. • Systematic error: Is caused by instrumentation error. Technique is good but equipment is faulty or un-calibrated. This will result in consistent but wrong readings.
11.1.1 Describe and give examples of random uncertainties and systematic errors. A random uncertainty can arise from inadequacies or limitations in the instrument, such as pinpointing the reading of a burette or graduated cylinder. Examples of a systematic error can be from reading a burette from the wrong direction, reading the top of the meniscus instead of the bottom, or using equipment that is not well calibrated.
IB Core Objective 11.1.3 Describe how the effects of random uncertainties may be reduced. Describe: Give a detailed account. (Obj. 2)
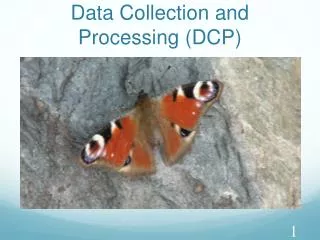
11.1.3 Describe how the effects of random uncertainties may be reduced. • We will be learning more about this when we do labs. • This is also why we ask you to collect data several times (3-5 times) for an experiment. • Repeating should increase the precision of the final result since random variations can be statistically cancelled out (or dropped if it is way off).
IB Core Objective 11.1.4 State random uncertainty as an uncertainty range (±) State: Give a specific name, value, or other brief answer without explanation or calculation. (Obj. 1)
11.1.4 State random uncertainty as an uncertainty range (±) Absolute uncertainty: Is the measurement you are guessing Ex: 25.0 cm3 pipette has an absolute uncertainty of ±0.1cm3 100cm3 beaker has an absolute uncertainty of ±1cm3
11.1.4 State random uncertainty as an uncertainty range (±) • Instruments may have the tolerance (i.e. uncertainty) clearly labeled. • If the tolerance is not labeled on the instrument, you will have to determine the uncertainty yourself. • A digital scale may bounce around on the last digit (i.e. between 3.759 and 3.760). The uncertainty would be ±.001. If it bounces around by five on the last digit, then it would be ± .005. • We will practice this in labs.
IB Core Objective 11.1.5 State the results of calculations to the appropriate number of significant figures State: Give a specific name, value, or other brief answer without explanation or calculation. (Obj. 1)
11.1.5 State the results of calculations to the appropriate number of significant figures Estimating the number Bathroom scale Balance Grape fruit 1 11.5kg 1.476kg Grape fruit 2 11.5kg 1.518kg Certain digits: The numbers we know Uncertain digits: The estimated number. The bolded numbers represent the guessed digit. Significant Figures The number of figures known + one guessed figure. • The bathroom scale has: 2 sig. Figs. • The balance has: 4 sig. Figs
11.1.5 State the results of calculations to the appropriate number of significant figures Leading Zeros (Zeros totheLeft of the decimal place) Don’t count! They are just place holders.
11.1.5 State the results of calculations to the appropriate number of significant figures Trailing Zeros (Zeros to the RightEnd of the number) Only count when the number contains a decimal place.
11.1.5 State the results of calculations to the appropriate number of significant figures Addition/Subtraction: When adding and subtracting data, use the measurement with the least number of decimal places.
11.1.5 State the results of calculations to the appropriate number of significant figures. Multiplication/ Division When multiplying and dividing, your answer should have the number of sig. figs as the one with the least number of sig figs.
IB Core Objective 11.2.1 State uncertainties as absolute and percentage uncertainties. State: Give a specific name, value, or other brief answer without explanation or calculation. (Obj. 1)
11.2.1 State uncertainties as absolute and percentage uncertainties. Percent uncertainty: Absolute uncertainty x 100 Amount used If we take a 30cm3 sample in the 100cm3 beaker (with a ± 1 uncertainty) what is the % uncertainty? % uncertainty = 1/30 x 100 3.33% If we take a 90cm3 sample in the 100cm3 beaker what is the % uncertainty? % uncertainty = 1/90 x 100 1.11% This is why taking small samples with a large beaker is not a good idea! Use the proper tool!!
IB Core Objective 11.2.2 Determine the uncertainties in results. Determine: Find the only possible answer. (Obj. 3)
11.2.2 Determine the uncertainties in results. Adding/ Subtracting uncertainties Just add the uncertainties of each piece of equipment Add the two volumes from the previous example 30 (±1) +90(±1) 120 (±2) (So range is 118-122)cm3. % uncertainty = 2 ÷ 120 x 100 0.83%
11.2.2 Determine the uncertainties in results. Multiply/Dividing uncertainties • Each measurement must have the % uncertainty calculated. • The % uncertainties are then added • The final % uncertainty is then used to re-calculate the final absolute uncertainty. Scale = 5.000g (±0.001) Pipette = 50.00cm3 (±0.01) Graduated cylinder = 25.0cm3 (±0.05)
11.2.2 Determine the uncertainties in results. Answer 0.001 ÷ 5.000 x 100 = 0.02% 0.01 ÷ 50.00 x 100 = 0.02% 0.05 ÷ 25.0 x 100 = 0.2% Total percentage = 0.24% If the molar mass in the end was determined to be 64.0 g/mol, then 0.0024 x 64.0 = 0.1536, So final answer is 64.0 g/mol ± 0.2g