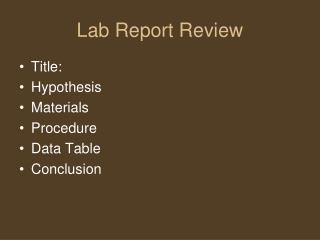
LAB REPORT
This report outlines the essential steps for preparing a scientific report, focusing on areas including the aim, hypothesis, variables, materials, and methods, followed by data collection and processing. It emphasizes the evaluation of results against the hypothesis, analysis of errors, and potential improvements to investigate further. The structured approach ensures clarity, facilitates practical applications, and helps in communicating findings effectively, making it useful for students engaged in scientific research.


LAB REPORT
E N D
Presentation Transcript
LAB REPORT DR. AYAX PEREZ
STEPS • TOPIC • APPROACH • USE • AIM • THEORY • HYPOTHESIS • VARIABLES
STEPS 8. MATERIAL AND METHODS 9. DATA COLLECTION 10. DATA PROCESSING 11. ANALYSIS 12. CONCLUSION 13. ERROR ANALYSIS
TOPIC • MAIN IDEA • SPECIFIC NAME • Something you are studying this year.
APPROACH • What area of your topic are you going to study? • How will you study your problem?
USE • PRACTICAL USE • REAL LIFE USE • How can your project help other people? • In what real life situation can your project be used?
AIM • Objective, Goal, Problem • First • Clear: whoever reads it, should understand what you want to do. • Concise (short) • Practical use!!! • Question form • If the teacher states the aim you shouldn’t just copy that down, you need to make it yours, in your own words, to get a full score.
THEORY • A general background that will back-up your hypothesis. • It must be related to your aim. • Should be short, but with enough information to produce a hypothesis. • It´s important to have several different sources in order to be reliable.
HYPOTHESIS • Educated guess • Cause and prediction of the investigation. • Needs to be very clear • Give an exact and complete description of what you think might happen (and why). • If … INDEPENDENT V... then… DEPENDENT V ... Because ... SCIENTIFIC EXPLANATION.
VARIABLES • INDEPENDENT VARIABLE • DEPENDENT VARIABLE • CONTROLED VARIABLES
INDEPENDENT VARIABLE • Is the one that you alter throughout your experiment. • You must have at least 7 variations of it. • You decide how to change the variable. • It must be chosen according to what you want to prove. • The variations will allow you to have different results and from them you can come to a real conclusion.
DEPENDENT VARIABLE • Is the variable that you measure. • It is the effect of the variable you modified. • You must explain how you will measure it. • It corresponds to `y` in the table and graph. • Explain how changes of the dependent variable were monitored. How you got your results.
CONTROLLED VARIABLES • The variables that you try to keep constant throughout your experiment so that they don’t affect your experiment. • You must explain how they will be controled during the experiment.
Materials and methods • List of all the equipment. • Size of beakers/measuring cylinders, etc, used. • State the error of measurement of the instrument. • Names of any chemicals or materials that are going to be used in the experiment. • Diagram (picture) experimental set up if necessary.
Materials and methods • Describe the method. It should be written in past tense (not written as a guide on how to carry out the experiment again, but rather, how you did it). • The steps in the experiment are either self-evident or explained.
Materials and methods • Write how you made sure that the sufficient relevant data was recorded. • Describe the method for data collection, i.e. if you had several trials, if you used controls, methods of measurements, if your calculations are correct, etc.
Data collection • Record all your raw data in tables. • The tables should be numbered and have captions in which you briefly describe the contents of the tables and how you recorded the results. • Titles, units and the uncertainty should be given in the headings of the tables. • Underneath the table you can briefly describe the results. You can describe the main trends and account for any anomalous result. • You don’t have to discuss the significance of the results to the aim of the investigation.
Data Processing and presentation • The data should be processed (calculated) correctly. • Presented in tables and graphs. • If you use graphs, they should have a caption in which you describe the contents of the graph. • The axes of the graphs have to be labeled with units and the points have to be plotted correctly. • Make sure that you use the correct type of graphs. If both variables are continuous, use a point graph. • Error analysis should be carried out if possible (calculate the percentage uncertainty, etc).
Analysis • Discuss the results you obtained in relation with your hypothesis. • Write an analysis based on an interpretation of the gathered results. • Compare your results with literature values if possible. • Remember you must relate your findings with your theory, hypothesis and aim!
Conclusion • State if your hypothesis is right or wrong in two sentences. • Remember your explanations were done in Analysis.
Evaluation • Evaluate the method used. • Write about the main weakness of the method used and the weakness in the method of manipulation of data. • Write about the source of error, but don’t include personal mistakes. • Suggest real improvements (that can be carried out in the school lab) to the investigation. • Discuss further investigations that are of interest and can be carried out and new questions that could be posed.