Lab Report 2
Lab Report 2. Which Fruit has more DNA?. Title Page. Name of Lab, Name of Student, Date, Period, Subject Name of Lab: Which Fruit has more DNA? The Rest should be self explanatory. Purpose/Hypothesis. Started on a new page…… Purpose: What do you think it is? Give Some examples?

Lab Report 2
E N D
Presentation Transcript
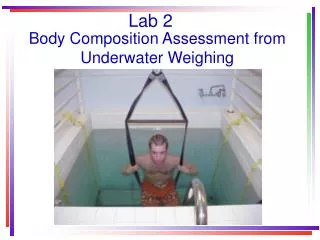
Lab Report 2 Which Fruit has more DNA?
Title Page • Name of Lab, Name of Student, Date, Period, Subject • Name of Lab: • Which Fruit has more DNA? • The Rest should be self explanatory
Purpose/Hypothesis • Started on a new page…… • Purpose: • What do you think it is? • Give Some examples? • To determine which type of berry has more DNA .
Purpose/Hypothesis • Hypothesis: • As a group you developed this…. • Your perdition will work as well…..
Purpose/Hypothesis • Strawberries will have more DNA per gram then any other berries. • If I extract the DNA from strawberries, blackberries, blueberries, and raspberries then strawberries will have more DNA per gram of berry.
Pre-Lab Questions • There are no Pre-Lab questions. • Here are some examples.
Materials • Contains a complete list of all the material used in the lab. • 8 test tubes 2 for each fruit • 10 mL of DNA extraction buffer solution per fruit • 4 Ziploc bags • Ice cold Isopropyl alcohol about 6 mL per fruit • Paper towels for clean up • Pencil • Paper • Lab apron • Safety glasses
Methods, Procedures & Safety Issues • Give me example of the procedures your group use.
Methods, Procedures & Safety Issues • Safety Issues • The use of Isopropyl alcohol means there should be no open flames, and gloves, safety glasses, and lab aprons should be worn. The fruit juice and buffer solution could stain clothes and should be handled with care. • Any other concerns you can think of?
Methods, Procedures & Safety Issues • Place fruit into a Ziploc TM bag and seal shut. • Squish for a few minutes to completely squash the fruit. • Add 10 ml DNA Extraction Buffer (soapy salty water) and squish for a few more minutes. Try not to make a lot of soap bubbles.
Methods, Procedures & Safety Issues • Filter through a coffee filter set in a funnel, and collect the liquid in a clear tube. Do not squeeze the filter. Collect about 3 ml liquid. • Add 2 volumes ice cold isopropyl alcohol to the fruit liquid in the tube. Pour the isopropyl alcohol carefully down the side of the tube so that it forms a separate layer on top of the fruit liquid.
Methods, Procedures & Safety Issues • Watch for about a minute. What do you see? You should see a white fluffy cloud at the interface between the two liquids. That’s DNA! • Spin and stir the coffee stirrer or transfer pipet in the tangle of DNA, wrapping the DNA around the stirrer.
Methods, Procedures & Safety Issues • Pull out the stirrer and transfer the DNA to a piece of saran wrap or clean tube. The fibers are thousands and millions of DNA strands. • Rinse your funnel. Put the Ziploc TM bag and paper towel in the garbage. • Pre-weigh a test tube and small beaker • Place the DNA in the test tube and measure the amount of DNA. • Repeat for each fruit
Data tables and/orGraphs • Data Tables should be well organized and easily understandable. It should also be properly labeled in order to improve clarity. • Graphs should fit the data that it represents. Should be labeled in a way to present the information in a clear and understand able way.
Discussion and Analysis • Contains a detailed and accurate account of the data. • What is the data saying… What do you get from it? • What happen when you combined the liquids? • What is the Data table showing • Use the Data in the discussion.
Discussion and Analysis • From analyzing the data we can see that blueberries have the largest amount of DNA per gram of fruit. To me this was surprising because blueberries are so small compared to strawberries. I thought that the larger fruit would have more DNA due to extra chromosomes.
Conclusion • My hypothesis was not supported by the data because it indicated that blueberries have more DNA per gram of fruit. Possible sources of error for this lab is not getting the amount of fruit equal. Also the amount/level of fruit liquid was not the same per test tube possible leading to less DNA.