Lab Report
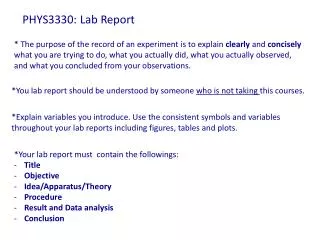
Lab Report. CMS Format Guide. Purpose/Abstract. Needs to be 2 to 4 complete sentences at minimum. What is the purpose of this lab? Should identify the question or problem and state it clearly . Purpose: Does the length of the straw have an effect on the size of bubbles which can be made?.

Lab Report
E N D
Presentation Transcript
Lab Report CMS Format Guide
Purpose/Abstract Needs to be 2 to 4 complete sentences at minimum. What is the purpose of this lab? Should identify the question or problem and state it clearly. Purpose: Does the length of the straw have an effect on the size of bubbles which can be made?
Hypothesis What do you think will happen as a result of your actions? (“If…then…because”) The format of “IF independent variable, THEN dependent variable BECAUSE…” works especially well with budding scientists in helping them learn the difference between INDEPENDENT VARIALBES and DEPENDENT VARIABLES
Example IF fertilizer is added to plants once per week, THEN the plants will grow BECAUSE fertilizer contains nitrogen which is needed for plant growth. INDEPENTENT VARIABLE – FERTILIZER DEPENDENT VARIABLE – PLANT GROWTH (MEASURED OR OBSEREVED)
Bubble Lab Hypothesis: IF the straw length is longer THEN the bubbles will be larger BECAUSE there is more air in the straw to create the bubbles. INDEPENTENT VARIABLE – Straw Length DEPENDENT VARIABLE – Size of the bubble (MEASURED OR OBSEREVED)
Materials Make a bullet list of all materials – Equipment, chemicals, specimens, amount/quantity – used in the experiment Materials for the Bubble Lab Soap solution (10% detergent and 90% water) Straws String Metric Ruler Paper and Pencil to construct Data Table
Procedure Step-by-Step Directions A step-by-step numbered procedure must be clearly written so that someone else could accurately repeat your experiment. The design must be a controlled experiment. You must identify the following: Independent Variable, Dependent Variable, Constants, Control Group
Bubble Lab Procedure Spread a small amount of the bubble solution on the table. Put one end of the standard size straw into the solution and start to blow a bubble on the table. As soon as the bubble pops, have your lab partner measure the size of the bubble with the string. Take the string and place it against a ruler to get the measurement (remember to use the metric side of the ruler). Complete steps 2 through 4 for the smaller straw (9.75) and the larger straw (29.25).
Bubble Lab Procedure Independent Variables – Size of the straw Dependent Variable – Size of the bubble Constants – Soap solution Control Group- Standard Size straw Experimental Group – Different sized straws
Data Collection and Measurements and Results Include all data (both quantitative and qualitative) in this section. Tables, charts, and/or graphs must be included where appropriate and properly labeled. Quantitative data is presented in table and/or graph format, not paragraphs! Qualitative data can also be presented in table format(e.g. observations by time) or in bullet points. Can be n a separate sheet of paper as long as there is a section in the report that says “DATA” – see attached results.
Data Collection and Measurements and Results “DATA” – see attached results.
Conclusion/Discussion/Analysis A one-line sentence that either says that the hypothesis is right or the hypothesis is wrong. Then write another 1 to 2 sentences justifying your conclusion. The hypothesis, restate the hypothesis, is correct/incorrect BECAUSE THE DATA SHOWS…
Conclusion/Discussion/Analysis The hypothesis, IF the straw length is longer THEN the bubbles will be larger BECAUSE there is more air in the straw to create the bubbles. ,is correct/incorrect BECAUSE THE DATA SHOWS…
Conclusion/Discussion/Analysis Write at least 5 sentences (minimum) about what your data is revealing. This is where you explain the meaning of your results (qualitative data). If you need to explain why something happened, you need to write it here. If calculations are required, they belong here. The analysis section is the part of the lab where you explain why your hypothesis (claim) is right or wrong based on the data (evidence).
Conclusion/Discussion/Analysis Remember, a lob is not about right or wrong, it is about being able to understand and communicate the evidence that supports or does not support your hypothesis or claim based on the procedure and your knowledge of the subject area.
Conclusion/Discussion/Analysis In general, the following questions should be answered: What was investigated Was the hypothesis supported by the data? What were your major findings? Are there any patterns to your data? How did your findings compare with other researchers in your class or in scientific settings? What possible explanations can you offer for your findings? Note any errors that may have affected the validity of your results. What recommendations do you have for further study and for improving the experiment? What are some possible applications of the experiment?
Citations Make sure that you cite any sources that you use in your experiment.