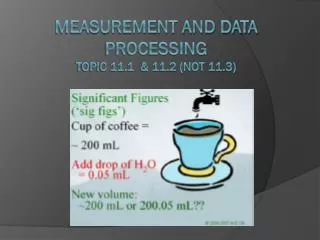
Measurement and data processing
Measurement and data processing. IB Chemistry HL 2009/2010. Measurement and data processing. 11.1 Uncertainty and error in measurement 11.2 Uncertainties in calculated results 11.3 Graphical techniques. Measurement and data processing. Measurement and data processing.

Measurement and data processing
E N D
Presentation Transcript
Measurement and data processing IB Chemistry HL 2009/2010 www.chemactive.com
Measurement and data processing 11.1 Uncertainty and error in measurement 11.2 Uncertainties in calculated results 11.3 Graphical techniques www.chemactive.com
Measurement and data processing www.chemactive.com
Measurement and data processing • In practical science, the results of experiments are never completely reliable as there are always experimental errors and uncertainties involved. • It is therefore important, especially in quantitative work, to be able to assess the magnitude of these and their effect on the reliability of the final result. • It is important to differentiate between the accuracy of a result and the precision of a result. www.chemactive.com
Measurement and data processing • What can you tell about the precision and accuracy in the adjacent figure? www.chemactive.com
Accuracy • The accuracy of a result is a measure of how close the result is to some accepted or literature value • Accuracy is a measure of the systematic error. If an experiment is accurate then the systematic error is very small. www.chemactive.com
Precision • The precision is a measure of how close the repetitions will be to each other. • The precision or reliability of an experiment is a measure of the random error. If the precision is high then the random error is small. www.chemactive.com
Measurement and data processing • Random uncertainties (or errors) arise mostly from inadequacy or limitation in the instrument or the way a measurement is made. • Random errors make a measurement less precise, but not in any particular direction. These are written as an uncertainty range, such as 44.20 ± 0.05 cm3. www.chemactive.com
Measurement and data processing • In the adjacent burette, We would probably take the reading as 43.6, but in so doing we are saying that it is nearer to 43.6 than it is to 43.5 or 43.7, and smaller than 43.65 ,hence we should record this value as 43.6 ± 0.05. • if we are reading a digital instrument, such as a balance, then we should record the uncertainty as being half of the last digit. For example the reading 37.361 on a digital readout should be recorded as 37.361 ± 0.0005. www.chemactive.com
Measurement and data processing • Large random uncertainties obviously decrease the precision of the values obtained and can also lead to inconsistent results if the procedure is repeated. • If only one reading is taken, then a large random uncertainty can lead to an inaccurate result. • Repeating experimental determinations should, however, increase the precision of the Final result as the random variations statistically cancel out. www.chemactive.com
Measurement and data processing • Systematic errors are due to identifiable causes, and arise from flow in the instrument or errors made in taking a measurement such as an incorrect calibration of a pH meter or reading the top rather than the bottom of the meniscus. • Systematic errors always affect a result in a particular direction (always smaller or larger) unlike random errors. • Random uncertainties can be reduced by repeating readings; systematic errors can not reduced by repeating readings. www.chemactive.com
Uncertainties in calculatedresults www.chemactive.com
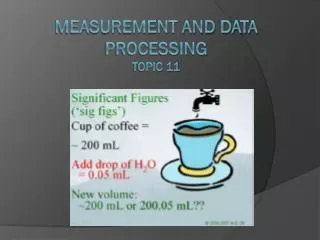
Uncertainties in calculatedresults Significant Figures • All non zero numbers are significant • 613 has three sig figs • 123456 has six sig figs • Zeros located between non-zero digits are significant • 5004 has four sig figs • 602 has three sig figs • Trailing zeros (those at the end) are significant only if the number contains a decimal point; otherwise they are insignificant • 5.640 has four sig figs • 120000 has two sig figs • Zeros to left of the first nonzero digit are insignificant they are only placeholders! • 0.000456 has three sig figs • 0.052 has two sig figs • 0.000000000000000000000000000000000052 also has two sig figs! www.chemactive.com
Uncertainties in calculatedresults Significant Figures • Rules for addition/subtraction problems • Your calculated value cannot be more precise than the least precise quantity used in the calculation. The least precise quantity has the fewest digits to the right of the decimal point. Your calculated value will have the same number of digits to the right of the decimal point as that of the least precise quantity. • 7.939 + 6.26 + 11.1 = 25.299 (this is what your calculator will give) In this case, the final answer is limited to one sig fig to the right of the decimal or 25.3 (rounded up) www.chemactive.com
Uncertainties in calculatedresults Significant Figures • Rules for multiplication/division problems • The number of sig figs in the final calculated value will be the same as that of the quantity with the fewest number of sig figs used in the calculation. • (27.2 x 15.63) ¸ 1.846 = 230.3011918 in this case, since the final answer is limited to three sig figs, the answer is 230. (rounded down) www.chemactive.com
Uncertainties in calculatedresults Significant Figures • Rules for combined addition/subtraction and multiplication/division problems • First apply the rules for addition/subtraction (determine the number of sig figs for that step), then apply the rules for multiplication/division. www.chemactive.com
Uncertainties in calculatedresults • Absolute and Percentage Uncertainties • The absolute uncertainty is the actual uncertainty in the value, for example ±0.05 for a quantity that has the value 28.5 ± 0.05. • The percentage uncertainty is the absolute uncertainty expressed as a percentage of the value. For example the percentage uncertainty of 28.5 ± 0.05 is ±0.18% (100 × 0.05/28.5) www.chemactive.com
Uncertainties in calculatedresults • The uncertainties in individual measurements can be combined to calculate the uncertainty in the final value of the quantity being determined. • In addition and subtraction: Add absolute uncertainties • In multiplication, division and powers: Add percentage uncertainties • If one uncertainty is much larger than the others, ignore the other uncertainties and estimate the uncertainty based on the larger one using the rules above. www.chemactive.com
Uncertainties in calculated results • calculate the value and uncertainty of X, where X = A (B – C) given the values: A = 123 ± 0.5; B = 12.7 ± 0.2; C = 4.3 ± 0.1 www.chemactive.com
Uncertainties in calculatedresults • X = 123 × (12.7 – 4.3) = 1033.2 • (note that this has not yet been rounded to an appropriate precision as the uncertainty has not been calculated) • Actual uncertainty in (B – C) = ± 0.3 (add actual uncertainties, 0.2 + 0.1 = 0.3) • % uncertainty in A = 0.407% (100 × 0.5/123 ) • % uncertainty in (B – C) = 3.571% (100 × 0.3/8.4 ) • % uncertainty in X = 3.978% (add percentage uncertainties, 0.407 + 3.571) • Actual uncertainty in X = 41.1 (1033.2 × 3.978/100 ) • Therefore X = 1033.2 ± 41.1 • The usual practice is to only give the uncertainty to one significant figure and then to round of the value to a similar number of decimal places; hence the final; result should be quoted as • X = 1030 ± 40 www.chemactive.com
Graphical Techniques Graphical Techniques www.chemactive.com
Graphical Techniques • Graphs are one of the most useful ways for interpreting scientific data because they allow for direct visual correlation between the data obtained and a particular scientific model or hypothesis www.chemactive.com
Graphical Techniques • When drawing graphs it is usual to choose the axes so that the independent variable (frequently time) is plotted along the horizontal axis and the dependent variable on the vertical axis. The scale should be chosen so as to maximize the use of the graph area, taking into account any extrapolation of the data that may be required. • Care must also be taken to have enough data points to ensure that the graph really is linear. For example it is questionable whether the data in Figure 1108 (a) really do represent a straight line rather than a curve. www.chemactive.com