Download
1 / 21
210 likes | 358 Vues
This workshop focuses on the precise measurement methods for assessing splice and diode interconnections, addressing the associated challenges and accuracy issues. Participants will explore safe and unsafe testing protocols for current cycles, data extraction challenges, and the utilization of advanced data analysis tools. Key topics include defining safety thresholds, verifying voltage protections, and performing necessary RRR measurements. Emphasis will be placed on efficiently detecting thermal runaway events and developing reliable workflows for the new nQPSmBS boards.

E N D
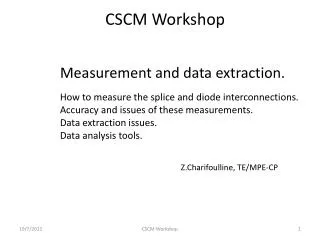
CSCM Workshop • Measurement and data extraction. • How to measure the splice and diode interconnections. Accuracy and issues of these measurements. • Data extraction issues. • Data analysis tools. Z.Charifoulline, TE/MPE-CP CSCM Workshop
How to measure the splice and diode interconnections. CSCM current cycles I Trip by nQPSmBS tplateau 4-6 kA Iplateau FPA if V>Vthr “unsafe” measurements Fast ramp down if V>Vthr dI/dt 500 A/s 1kA dV/dt to open the diodes 500 A “safe” measurements H. Thiesen – 16 August 2011 – TE-TM t1 t2 t 60 s PC in voltage mode PC in current mode CSCM Workshop
How to measure the splice and diode interconnections. • 0.5 – 1kA tests (“safe”): • It is safe since any errors in protection thresholds will cause a trip but not yet a burning of any splices or diodes • 60s@1kA ramps to verify new QPS hardware and software • RRR measurements (board A) • Rdiode measurements at low current (board B – board A) • define, load and verify voltage thresholds of mBS boards On this step the tests still can be performed by use of conventional splice protection boards (nQPS BS ) and can be analyzed by existed software (SM), but we need to check new hardware and software. • 4 – 6kA tests (“unsafe”): • It is not safe since a single error in protection thresholds may cost as a burning of defective splice or diode! • 10s@4kA->60s@4kA->10s@5kA->60s@5kA->10s@6kA->60s@6kA (see A.W. talk) • redefine voltage thresholds after every ramp -> reload and verify if needed! • Rdiode measurements and case analysis for high values before next ramp • correctly detect runaway event if so for detailed off-line analysis later on To be able to detect correctly the thermal runaways (or CSCM evnts) we need much faster DAQ . And we need parallel Board A&B measurements to distinguish runaways from high diode lead resistances. So this is why the nQPSmBS board was born! (Jiens child) CSCM Workshop
How to measure the splice and diode interconnections. “nQPS BS” boards will be replaced by “nQPSmBS” boards. But it will be no any additional patches => so voltage taps will be still the same. (see A.W, J.S. talks) nQPS BS Board A: EE012<->EE013 (Bus bar) nQPS BS Board B: EE014<->EE015 (Bus bar + 2 DLs) CSCM Workshop
TT 893 PT 100 ( TT 811 ) EE 11 , EE 12 Copper U_RES EE 21 , EE 22 PT 100 U_HTS HTS He Liquid level EE 3 1 , EE 3 2 EE 4 1 , EE 4 2 • How to measure the current lead interconnections? Current lead protection (nominal) Board A Board B Meaning EE11 - EE21 EE12 - EE22 Copper part of C.L. LD1:U_RES LD1:U_HTS EE21 - EE31 EE22 - EE32 HTS part of C.L. U_BB_1 EE41 - EExx EE42 - EExx From bottom of HTS We are not going to measure the current leads? The first bus bar segments will be protected and measured exactly the same way as others. (as it is now in the tunnel at cold) Only the difference, that they had never been measured at warm (biddle testing, RRR?) and there is no diode from one side. 1st Bus Bar segment nQPS 1st crate: BS or mBS 1st Magnet: EE012, EE013 (Board A) EE014, EE015 (Board B) CSCM Workshop
How to measure the splice and diode interconnections. Bus Bar Splice Defect ∆t 6 kA Bus Bar Segment Resistance (plus diode leads Board B) 1kA QP3-simulation: RB Bus Bar, RRRBUS=200, RRRSC=120 Temperature = 20K Length = 30 and 40m Single Side Defect = 2, 10, 20, 30, 40, 50mm Current = 1kA and 6kA CSCM Workshop
How to measure the splice and diode interconnections. 1 kA Simulation: RB, Sector12 Real Bus Bar lengths T=20±2K, RRR=200±50 ±50uV noise mBS: 5Hz@305nV Simulation: RB, Sector12 Real Bus Bar lengths T=20±2K, RRR=200±50 ±50uV noise mBS: 5Hz@305nV U01kA It would be the nice bus bar length pattern if RRR and THe are constant! Dipole: 15m <-> 55m, but mainly ~30m and ~40m Quads: 100m <-> 250m, but in some cases ~450m! ~60-100s, 5Hz => 300-500 points • - U01kA values will be calculated and stored for boards A and B • to be used to define 4kA thresholds: Uthr = 4*U01kA + Usafe • (UB – UA) will be the diode leads voltages (analysis will be added) • bus bar resistances will be calculated (=>RRR, +length or 300K tests) CSCM Workshop
There are important voltage drops to worry about... • How to measure the splice and diode interconnections. Calculated [BA23.L1<->BB22.L1] 30 … 100m <-> 10 … 40mV 1kA A23L1 B22L1 14.7A 24mΩ 5-40uΩ 25mΩ 17uΩ Cable 4 Cable 3 Cable 1 magnet bridge splice magnet Cable 2 bridge ~1V 2.2Ω 250uV ~50uA 5.1Ω 33uA 16uA 11kΩ 22kΩ 82uV 248uV 403uV 73uV So CSCM will be at least one more RRR-measurements within 5% but without complicated corrections and for whole sector. Timber 352mV 367mV Correction can be 70% of signal! M.K. TE/MPE, 13-01-2011 Length cable 2= 29m Length cable 3= 66m ~3-5% CSCM Workshop
How to measure the splice and diode interconnections. 6 kA ∆t Simulation: RB, Sector12 Real Bus Bar lengths T=20±2K, RRR=200±50 ±50uV noise mBS: 5Hz@305nV ~30mm defect! Board A • - U06kA values and thresholds calculated from previous 10s@6kA ramp! • (UB – UA) will be the diode leads voltages (analysis will be added) CSCM Workshop
How to measure the splice and diode interconnections. 6 kA Simulation: RB, Sector12 Real Bus Bar lengths T=20±2K, RRR=200±50 ±50uV noise mBS: 5Hz@305nV ~30mm defect! 20µΩ white noise added! (diode leads simulation) Board B • - U06kA values and thresholds calculated from previous 10s@6kA ramp! • (UB – UA) will be the diode leads voltages (analysis will be added) It is extremely important to collect and analyze the test data from every ramp > 4kA for both Boards A & B and to define and load correct thresholds for every channel! Thresholds calculation might be not so trivial, especially for dU/dt of board B. CSCM Workshop
Data extraction issues and analysis tools. Calculated thresholds • threshold calculations, U and dU/dt? • saving to proper files for loading • check after loading for data consistency CSCM Workshop
Data extraction issues and analysis tools. nQPS BS: Cold Splice Protection and Measurement Magnet Logging DB U_RES(t), U_MAG(t) I_MEAS(t) nQPS BS (A&B) 2 3 1 U_MAG: LSB=1.9µV, Range=±15.9V PtP≈500µV(noise) U_RES: LSB=1.5nV, Range=±12.8mV PtP≈50µV-100µV (noise) 5Hz, 50points moving average (10s) 2048 channels (x2) MB 301 ± 85pΩ MQ 306 ± 313pΩ 2048 total 30 bus bars > 1.2nΩ 10σ for MB 3σ for MQ Bus Bar 4 Magnet CSCM Workshop
Data extraction issues and analysis tools. nQPSmBS: CSCM Magnet Logging DB U_RES(t) I_MEAS(t) nQPSmBS (A&B) 2 3 1 U_MAG: LSB=1.9µV, Range=±15.9V PtP≈500µV(noise) U_RES: LSB=305nV, Range=±2.5V PtP≈50µV-100µV (noise) 16.5Hz, nofiltering 2048 channels (x2) Bus Bar T=20K RBB_dipole = 0.36µΩ/m => 10-20mV@1kA RBB_quad = 0.57µΩ/m => 50-250mV@1kA Rdiode lead = 5-20µΩ => 30-120mV@6kA 4 Magnet 5Hz from TIMBER or Front End • Main changes: • 16.5Hz DAQ, no filtering; • 5Hz data available in logging DB; • 16.5Hz@3000 internal buffers (for boards A&B!) ; • (see J.S. talk) A&B Buffers extractions need to be added to the existing data flow. CSCM Workshop
Data extraction issues and analysis tools. Test 3min Buffers extraction2x15min By Test Operator Special Macro or LabView Application will toggle ST_BOARD_A to avoid board mixture By Test Operator Special Macro or LabView Finally Test Data stored in Logging DB and ready for analysis. But the timescales need to be correctly reconstructed (5Hz -> 16.5Hz) 3000@16.6Hz, ~180s It will give absolute time reference for all curves within ±200ms and guarantee correct analysis of runaways By courtesy of A.Gorzawski CSCM Workshop
Data extraction issues and analysis tools. Data stored in Logging DB and ready for analysis. But the timescales still need to be correctly reconstructed (5Hz -> 16.5Hz) DS buffers reading application - adapted already for mBS buffers. Data can be saved and analyzed in EXCEL. • QPS DB (develop.) • BS signals • DS signals • Bus Bar Lengths • Splice cold resistances • and many more … Arkadiusz By courtesy of A.Gorzawski CSCM Workshop
Data extraction issues and analysis tools. • Summary: • mBS DAQ is sensitive and fast enough to make measurements at mV ranges; • bus bar RRR can be re-measured within 3-5% (will depend on THe stabilization); • mSB buffers triggering and extraction procedures established and checked; • all data will be saved to logging DB with absolute time stamps (<1s) and A/B signatures, which allow correct off-line expert’s analysis; • Special Java Application developing to read the data from logging DB, to reconstruct the timescales, to save data to csv-files or to QPS DB for online analysis of the whole considered sector. • Splice Monitor application (or new) will be upgraded for new requirements: • board A/B analysis, thresholds estimations and preparing for loading; • diode leads resistance evaluation from two boards data; • and needs to be very reliable and be checked before going to high currents; CSCM Workshop
Thanks! CSCM Workshop
How to measure the splice and diode interconnections. 40mm, 15K, 20K, 25K 15K, 20K, 25K 30mm RB, 30m, 6kA He-Bath temperature variation effect CSCM Workshop
Diode lead ‘resistances’ for 6 kA quenches Conclusion: Large spread among the 12 leads. ‘Steps’ occurring in first 15 s. 5 mW: maximum measured at reception in SM18 13 mW: specification during reception in SM18 CSCM Workshop
Diode lead ‘resistances’ for B15R5 Anode Conclusion: Inductive signal is small. Results indicate the presence of one or more irregular contacts. The three 6 kA curves differ a factor 2. CSCM Workshop
Some numbers CSCM Workshop