Data Processing Techniques: Fourier Analysis and Digital Filtering in Geoscience
In this chapter, we explore critical data processing techniques essential for science majors, focusing on handling noisy data and the importance of Fourier analysis. We will delve into how to separate signals by wavelength using harmonic analysis, highlighting the benefits of isolating dominant frequencies to improve data accuracy. Additionally, we discuss digital filtering methods, including low-pass, high-pass, and band-pass filters, detailing their application and effects on data quality. Understanding these concepts will enhance your employability and your ability to analyze complex geologic data.

Data Processing Techniques: Fourier Analysis and Digital Filtering in Geoscience
E N D
Presentation Transcript
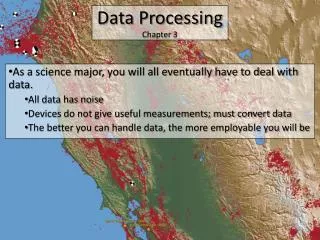
Data ProcessingChapter 3 As a science major, you will all eventually have to deal with data. All data has noise Devices do not give useful measurements; must convert data The better you can handle data, the more employable you will be
Wavelength and Fourier Analysis A Simple Example… • The granite produces a negative gravity anomaly • Variations in the sediment cover cause noise in the data • The noise and the anomaly have different wavelength scales • Fourier analysis • Separates signals by wavelength
General Wave Terms a • Amplitude (a) = • Wavelength (λ) = • Frequency = • Period = Amplitude 0.5a 0 0.5 λ λ 1.5 λ 2 λ Wavelength (λ) 0.5a -a
Harmonic Analysis 1st 5 harmonics 1 • Harmonics: multiples of a signal’s half wavelength, L • Why use harmonics? • Found in nature and music • Like a guitar! • Any wiggly line can be mathematically reproduced by adding together a series of waves • Exact match requires ∞ waves 0.5 0 0.2 L • 0.4L • 0.6L • 0.8L • L 0.5 -1
Fourier Analysis Data Separated by Wavelength • A type of harmonic analysis where wiggly data are separated into various harmonics of differing amplitude • Adjusts the amplitudes of each harmonic • Can isolate dominant frequencies/wavelengths in data and remove unwanted ones • Sum of ∞ harmonics reproduces data exactly Sum of same harmonics, but with different amplitudes
What to Remove? • In this tide data, what type of wavelengths (short or long) should we remove? • What causes each?
Caveats of Fourier Analysis • Requires a complete signal • Starts and ends at same value • Only analyzes wavelengths that are multiples of the signal length • Geologic targets likely have multiple wavelengths and may share some wavelengths with noise.
Digital Filtering • An alternative way to remove unwanted wavelengths/frequencies: Filtering • Usually applied to regularly space data • If data not regular, interpolation can be used • E.g. A simple 3-point filter :: 1/3 (yn-1 + yn + yn+1) • Also called • 3-point running average • 3-point moving window 1 2 3 4 5 6 7 8 9 10 Time or Distance 1 0 5 4 9 4 2 3 1 5 Value 3 6 X 2 Filtered Value • There are also 5-point, 7-point, and n-point filters. • Some are weighted to remove certain wavelengths
Effects of Digital Filters • Low-pass filter • Also called Smoothing filter • Allows low freq to “pass through” • High-pass filter • Allows high freq To “pass through” • Band-pass filter • Constructed to only let certain “bands” or frequencies through A subwoofer in a bandpass box
Effects of Digital Filters • A given filter may have a very different effect on data depending on: • Wavelength • Sampling Rate / Resolution • A filter can completely decimate a signal
Aliasing • If sampling rate (resolution) approaches wavelength of signal • May see false patterns • If sampling rate is less than signal’s wavelength • May see false long wavelength signals • Aliasing: Discrete (non-continuous) data can suggest patterns that are not real • Nyquist wavelength = half the signal’s wavelength. • This is the minimum sampling rate to avoid aliasing
Gridded Data Processing • All of the data processing techniques discussed here can also be applied to gridded or even three-dimensional data • Can filter directional noise • Highlights directional features • Geologists should pay attention in multivariable calculus class! • E.g. MAT 2130 - CALCUL ANALY GEOM III • Do not rely on black box computer programs • E.g. Arc GIS
Filtering in 2D :: Gridded Data • Filters can be created to filter all types of data • No technique is perfect • Great care must be given when creating a filter or processing data in general