Enhancing Software Instability Analysis Through Dependence Graph Visualization
This project presents a novel method for analyzing instabilities in software packages by utilizing a time series of dependence graphs extracted from a software configuration management (SCM) repository. By employing directed graphs with attributed nodes and edges, this approach visualizes program dependencies and their relations, leading to insights on system modularity. The visualization employs a geological metaphor to represent instabilities as fault lines and aggregates change data across revisions, enabling prioritized refactoring and improving system design.

Enhancing Software Instability Analysis Through Dependence Graph Visualization
E N D
Presentation Transcript
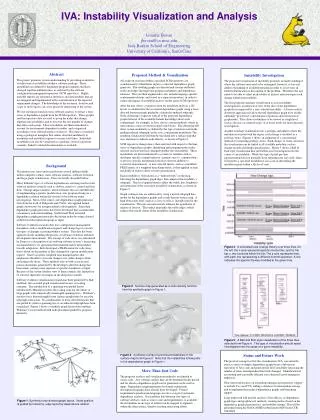
Proposed Method & Visualization All archived revisions within a specified SCM repository are asynchronously submitted as input to a selected dependence graph generator. The resulting graphs are directed and contain attributed nodes and edges that represent program statements and dependence relations. They are then augmented to also include language-specific containment relations, and stored in a separate repository, in order to reduce the impact of instability analysis on the active SCM repository. After the user selects a target revision for instability analysis, a 2D layout is calculated for the associated dependence graph, using a force-directed layout manager guided by a hierarchy-induced subgraph. Node clustering is expected with all of the proposed dependence graphs because of the available domain knowledge about node containment: for example, in Java, classes contain methods, which in turn contain a series of nested scoped code blocks. The clustering will show system modularity as defined by the type of relation used in the guiding induced subgraph: in this case, containment modularity. The resulting visualization will then be translated into a surface map that uses elevation to indicate node density, as shown in Figure 2. SCM repository change data is then analyzed with respect to the time series of dependence graphs, identifying and grouping nodes in the selected revision that have changed together into instabilities. These instabilities are then normalized to account for variables such as developer-specific commit behavior (commit-once vs. commit-often) or process-specific maintenance practices (feature addition vs. corrective maintenance). A user-selected metric, such as a modified FILES metric or a weighted time-damp metric, is then applied to each instability in order to allow severity prioritization. Each instability is then drawn as a “fault network” on the map, following the dependence graph edges that comprise the instability’s subgraph. The set of applied metrics affect the width, hue, brightness, and saturation of the associated instability visualization, as shown in Figure 3. Graph scaling issues are addressed by using a nested-subgraph data model for the dependence graphs and a node-density surface map. A high abstraction level, such as a class or a file, is initially used for the visualization. The user can interactively enhance the granularity of regions of interest. The surface map hides the stable edges, which reduces the overall clutter of the instability visualization. More Than Just Code The proposed analysis and visualization method is not limited to source code. Any software artifact that can be deterministically parsed and for which a dependence graph can be generated can be used as input. Dependence graph generators for formal architecture description languages have already been developed. Formal requirements specification languages are also a target of automatic dependence analysis. If traceability data between two types of software artifacts, such as source code and requirements, is available, the instabilities in one type of artifact can be mapped to segments within the other artifact, thereby assisting refactoring efforts. Abstract This project promotes system understanding by providing an intuitive visualization of instabilities within a software package. These instabilities are defined by dependent program segments that have changed together multiple times, as archived by the software configuration management repository (SCM repository). Highly unstable regions are expected at interfaces and data modules that are not designed and implemented with a consideration of the expected requirement changes. The knowledge of the existence, location, and scope of such regions can assist proactive refactoring of the system. We use existing research in static software analysis to extract a time series of dependence graphs from the SCM repository. These graphs and the repository data are used to group the nodes that change together into instabilities and to discover the raw number of changes that affect each group. These instabilities are then normalized to account for environment-dependent variables, and categorized according to user-selected metrics of interest. This data is visualized using a geological metaphor that relates structural modularity to mountains and instability regions to seismic fault lines. Individual instabilities can also be visualized as a geologic strata of repository commits, linked to related documentation as available. Background This project uses ideas and research from several different fields within computer science: static software analysis, software evolution, and large graph visualization. These are briefly described below. Many different types of software dependencies are being used in static software analysis research, such as def/use, points-to, control and data flow. Change impact analysis, which estimates the cost and difficulty of implementing a specific modification, uses program slicing on a dependency relation within the version of the software under investigation. Most of the source code dependence graph generators stem from the work of Podgurski and Clarke, who applied formal graph constructors for intraprocedural code fragments. Since then, dependence graph generators have been developed that accommodate concurrency and event handling. Stafford and Wolf extended dependence graph generation into the design realm by using a formal architectural description language as input. Software evolution research often uses configuration management documents such as modification requests and change logs to classify the types of changes occurring within a system. This data has been applied towards modeling the process of software evolution within its development environment. The concept of code decay was introduced by Parnas as a description of an evolving software system’s increasing incompatability to its operational environment and its intractability towards adaptation. Eick developed a FILES metric for code decay that is based on the number of files changed for a given modification request. Graves created a weighted time-damped metric that emphasizes the effects of recent changes over older changes when analyzing code decay. These methods rely on both accurate and precise documents generated by the developer after the change has been made, causing some rejection of specific documents as input. Because of the system-lifetime view of their research, this limited use of selective input does not imply an invalid process model. Software evolution visualization research has been pioneered by Ball and Eick, who avoided graph visualization because of scaling concerns. The introduction of a spanning-tree guided layout introduced by Munzner resolves the scaling issue for the subset of large graphs with semantically meaningful spanning trees. Walshaw’s iterative force directed graph layout clusters graph nodes by iterative subgraph contraction. No combinations of force-directed layouts that are guided by either a spanning-tree or an induced-subgraph have been researched. Figure 1 shows a synthetic graph layout that combines Walshaw’s layout method with node placement guided by program hierarchy. Instability Investigation The proposed visualization of instability promotes an understanding of where the software may need to be redesigned; however, it does not address the linking of available metadata in order to assist users in further identification or description of the problem. Therefore, the user needs to be able to select an instability of interest and investigate each change within that instability. The first proposed auxiliary visualization to assist instability investigation is an interactive view of the slice of the dependence graph that is impacted by a user-selected instability. A focus+context distortion approach will allow the full dependence graph to be visible (although “grayed out”) and dynamic expansion and contraction of graph nodes. This allows instabilities to be viewed at a high level, such as the class or method scope, or at lower levels for more directed investigation. Another auxiliary visualization uses a geologic metaphor to show the metadata associated with the region: each change is modeled as a geologic strata. Figures 4 shows an adaptation of a conventional method of visualizing geologic strata. Each change, or strata, shown in the visualization can be linked to all available metadata, such as change records and design specifications. Figure 5 shows a Ball & Eick style visualization that can further assist investigation into the causes of an instability. While this type of pixel-per-line representation does not normally show dependencies very well, when restricted to a specified instability it can assist in identifying the unstable regions within a file-level view. Status and Future Work The proof-of-concept tool for this visualization, IVA, can currently extract a series of simple dependence graphs from a Subversion repository of Java code and generate file-level instability data using the number of times interdependent files both changed. Identification of an existing and reasonably efficient force-directed layout manager is underway. Near-term work focuses on extending language and repository support to include C++ and CVS, adding a database for intermediate storage, and to implement hierarchical dependence graphs and branching support. Long-term work will include analysis of the efficacy of dependence graph types and graph layout methods, creating metrics based on the dependence graph characteristics, and usability testing. This will be performed using the NASA AMES testbed under NSF Grant CCR-01234603 IVA: Instability Visualization and Analysis Jennifer Bevan jbevan@cs.ucsc.edu Jack Baskin School of Engineering University of California, Santa Cruz Figure 4: A simulated local change history over three files. On the left, the x-axis represents specific source files, and for file bar.c, two functions within the file. The y-axis represents time, with each line representing a different commit operation. A line indicates the specific file was modified at the given time. Figure 2: Surface map generated as a node density function from the synthetic graph in Figure 1. Figure 5: A Ball and Eick-style visualization of the three files selected from Figure 4. This type of visualization should assist investigation into the cause of a given instability. Figure 3: Synthetic overlay of prioritized instabilities on the surface map from Figure 2. Note that the instabilities follow paths in the dependence graph in Figure 1. Figure 1: Synthetic force-directed graph layout. Node position is guided by hierarchy, edge layout by dependence relation.