Download
1 / 50
500 likes | 526 Vues
Explore the causes and consequences of inbreeding in livestock through a genomic perspective. Learn about managing genetic diversity, inbreeding depression, and the use of alternative measures in breeding strategies. Uncover regions of the genome associated with inbreeding depression and more.

E N D
Causes and Consequences of Inbreeding: a Livestock Genomic Perspective Christian Maltecca North Carolina State University IUFRO Genomics and Forest Tree Genetics
Finding a common thread… IUFRO Genomics and Forest Tree Genetics
Genetic Diversity and Genomic Information • Implementation of genomic selection should result in a lower rate of inbreeding per generation IUFRO Genomics and Forest Tree Genetics
Genetic Diversity and Genomic Information • Genomic information to constrain inbreeding and monitoring losses of genetic variance • Works in principle • Lack of effective implemented strategies • Three pillars of genetic diversity management: • Understanding the basis and consequences of genetic diversity • Managing the population by controlling its effective size • Optimize genetic variability use through mating plans IUFRO Genomics and Forest Tree Genetics
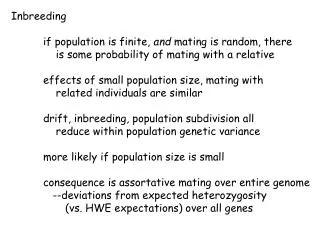
Inbreeding Depression Heterogeneity • What does a inbreeding value of 0.10 or 0.2 really stands for? • Differences exist among individuals on the amount of “depression” caused by a certain level of inbreeding • Inbreeding as we express it is a “bad” • measure because it is not truly linked • to a probability of “culling” IUFRO Genomics and Forest Tree Genetics
Inbreeding Depression Heterogeneity • Since inbreeding (and inbreeding depression) are function of dominance…one would be tempted to just estimate marker effects • With genomic information that should be possible • A few problems… • Low freq. • Small effects • Cumulative effect (non linearity of inbreeding depression) • Still can be attempted IUFRO Genomics and Forest Tree Genetics
Inbreeding Depression Heterogeneity • Alternative metric that characterizes long stretches of inbreeding in the form of a run of homozygosity (ROH). • Simulation has shown to be most associated with the recessive mutation load (Keller et al. 2011) in comparison to other metrics. IUFRO Genomics and Forest Tree Genetics
Regions of the genome that have a high frequency of runs of homozygosity (ROH) are linked to a reduction in genetic diversity as well as adverse effects on fitness. • Stretches of shared haplotypes can be identified based on long (> 5Mb) ROH persisting in the crossbred. IUFRO Genomics and Forest Tree Genetics
Two examples of the use of alternative measures of homozygosis in livestock • Cattle • Swine • A couple of tools that we have put together to help us along the way • Haplotype finder • Genome simulator (yet another ) IUFRO Genomics and Forest Tree Genetics
Distribution of ROH and its association with inbreeding depression in cattle IUFRO Genomics and Forest Tree Genetics
Identify regions in stretch of homozygosis causing reduction in phenotype: • Yield traits: Milk (MY), Fat (FY) and Protein Yield (PY) • Calving Interval (CI) Characterize the relationship between the additive and ROH effect across the genome. AU USA Jersey pop IUFRO Genomics and Forest Tree Genetics
Two-stage Analysis • Stage 1: Remove portion explained by estimated breeding value from YD: • A constructed based on Henderson (1976) recursive algorithm which assumed non-inbred. • Stage 2: Use the Residuals from Stage 1 to conduct: • Single Marker Regression Analysis: - Significance (P-value < 0.001) declared based on permutation analysis (n = 2500) • Gradient Boosted Machine (GBM): • Similar to Random Forest, but not as computer intensive • Number of trees = 1200; Interaction depth = 5; Shrinkage Parameter = 0.0075 via 4-fold cross-validation. • Significance (P-value < 0.001) declared based on permutation analysis (n = 2500) IUFRO Genomics and Forest Tree Genetics
Regions of the genome associated with a ROH of at least 4 Mb for traits across countries. IUFRO Genomics and Forest Tree Genetics
Significant ROH by ROH interactions IUFRO Genomics and Forest Tree Genetics
Chr Add ROH Cov (A ROH) IUFRO Genomics and Forest Tree Genetics
The use of alternative genomic metrics in swine nucleus herds to manage the diversity of purebred and crossbred animals IUFRO Genomics and Forest Tree Genetics
How can genotyped animal information in the nucleus herds be leveraged across breeding tiers? Maternal Line 1 Maternal Line 2 • Manage crossbred genome: • Maximize heterosis • Breed Complementarity • Manage nucleus genome: • Genetic diversity • Breed divergence • Deleterious recessive mutations Terminal Line Crossbred Dam Market Animal • Routinely Genotyped Animals • Not Routinely Genotyped Animals IUFRO Genomics and Forest Tree Genetics
Genomic Relationship constructed utilizing dams born in 2012 • Large White (n = 1341) • Landrace (n = 1144) • Duroc (n = 1512) • On a genome-wide basis breeds are clearly different. • Is their portion of the genome that are in common? IUFRO Genomics and Forest Tree Genetics
The persistence of ROH in crossbred dam confirms shared haplotypes across two maternal breeds. IUFRO Genomics and Forest Tree Genetics
In the commercial animal the majority of the long ROH stretches have been removed, although there is a few stretches that do persist at a low frequency. IUFRO Genomics and Forest Tree Genetics
Assess the impact of using pedigree or genomic relationship matrices in mating designs on the diversity in the progeny. • Assess the ability of pedigree or genomic relationship matrices to maintain diversity in regions with reduced genetic diversity. IUFRO Genomics and Forest Tree Genetics
Duroc Landrace Large White Females (n=1144) Females (n=1512) Females (n=1341) Males (n=81) Males (n=99) Males (n=538) SNP (n=34,904) SNP (n=41,489) SNP (n=39,671) SNP ROH5 (n=41,272) SNP ROH5 (n=34,179) SNP ROH5 (n=39,488) IUFRO Genomics and Forest Tree Genetics
Mating Pairs were chosen based on: • Random (R) • Minimize relationships using • Pedigree (A)(Henderson 1975) • SNP-SNP based (GRM) (Yang et al. 2011) • ROH of 5Mb based (ROHRM)(Pryce et al. 2012; Hickey et al. 2013) IUFRO Genomics and Forest Tree Genetics
Within Each Breed: Full List of Dams Full List of Sires Replicate 50x Sample 625 Dams Sample 25 Sires Mates chosen via sequential selection of least related mates and one progeny simulated from observed parent genotypes • Quantile based Estimates • SNP heterozygosity • Frequency of a SNP being in an ROH • Length of ROH for a given SNP in an ROH • ([0, 49.99]-[50, 74.99]-[75, 89.99]-[90, 100] • Genome Wide Estimates • Pedigree based inbreeding • SNP heterozygosity • Proportion of the genome in a ROH IUFRO Genomics and Forest Tree Genetics
The use of genomic relationship matrices reduce the length of ROH and therefore could be utilized to minimize the hitchhiking effect of selecting QTL QTL IUFRO Genomics and Forest Tree Genetics
Long stretches of ROH do persist in the crossbred animals. • Utilizing genomic information to constrain relationships results in the maintenance of greater genetic diversity in comparison to A. • The use of a ROH based relationship shrinks long homozygous stretches more so than the traditional SNP based metric. • In the absence of functional information on inbreeding depression can be used to take a “shotgun” approach to manage the diversity and fitness of the population IUFRO Genomics and Forest Tree Genetics
Identify genomic regions in Landrace and Large White that when in a long stretch of homozygosity cause a reduction in fertility. • Identify the haplotype(s) within these regions that cause a reduction. IUFRO Genomics and Forest Tree Genetics
Outline of the Identification of Unfavorable Haplotypes Step 1: Bayesian Ridge Regression Step 2: Effect of ROH Window ROH Window of 5 Mb • Determine which ROH window is statistically the most unfavorable. • Estimate Least Square Mean (LSM) for a window being in an ROH or not in ROH. • Yield deviations regressed on additive effect and effect of SNP when it is in an ROH of 5 Mb (ROH5SNP). • Regions in the top 10% 1 Mb ROH5 SNP variance were investigated further. Step 3: Effect of ROH Haplotype ROH Haplotypes Candidates • Using the phenotype as a proxy identify the smallest ROH haplotype(s) that has an unfavorable effect • Initial Scan: An an initial screen, scan across the region utilizing decreasing windows sizes starting at 60 SNP and decreasing by 5 until a length of 20 is attained and perform some elimination steps. • Final Scan: Utilize the model below to statistically test the significant difference of a ROH haplotype against a Non-ROH haplotype.
Landrace IUFRO Genomics and Forest Tree Genetics
Large White IUFRO Genomics and Forest Tree Genetics
Variability in the frequency of ROH does exist across the genome of swine populations. • The impact of regions that are in a long stretch of homozygosity have been characterized for some fitness traits. • Relationship between A D and ROH are complex and depend on pop structure and genetic architecture. • ROH can potentially be used to identify D variation and especially for non-lethal detrimental mutations, provided that ROH are relatively frequent (small Ne) • Future research should test if region/age specific inbreedingrather than measures of average level of inbreeding across the genome can used in mating programs that aim to minimize inbreeding as well as maximizing crossbred performance IUFRO Genomics and Forest Tree Genetics
https://github.com/jeremyhoward/GenoDriver IUFRO Genomics and Forest Tree Genetics
A fast haplotype finder of negative combined effect • The ROH genotype is equal to having two of the same kind of haplotypes. • Due to this regression can be done on ROH genotype string instead of using a haplotype based model. • ROH haplotypes have a nested structure therefore methods that capitalize on this can be utilized. • An ROH is generated when chromosome segments are inherited that are derived from a common ancestor. • Due to this individuals that have the same unique ROH segment are expected to have a “core segment” that is consistent across individuals and can be used as a proxy for the whole ROH segments that may differ outside of the core segment. IUFRO Genomics and Forest Tree Genetics
Stage 1: Trap set of animals with same core nested ROH haplotype to smallest possible haplotype which then serves as proxy for all variable length ROH haplotypes of the animals. • Start at window length of 60: • Window from SNP 1-60: • Tabulate means Non-ROH and each unique ROH • Keep any ROH haplotype above a certain frequency and phenotype. • Slide Window by one SNP until reach the end of chromosome. • Finished with length of Window 60 for a given Chromosome. • Combine nested windows (same animals and one extra snp at end). • Decrease Window length by 5 and repeat the same process as above until reach window length of 20. Before After IUFRO Genomics and Forest Tree Genetics
Stage 1 (Continued): • Same animals contained within windows (i.e. nested) then only keep shortest one. Nested IUFRO Genomics and Forest Tree Genetics
Stage 2: Test the trapped ROH haplotypes for significance by directly solving mixed model equations while taking into account large degree of redundancies. • Set up linear contrasts between non-ROH versus each unique ROH. • Fixed variances that are based on a model without ROH effect. • Store anything with an absolute t-value greater than 2.326. LHS Fixed ROH Fixed Fixed Dam Fixed Ide(Dam) Fixed y ROH Dam ROH ide(Dam) ROH y ROH = Dam ide(Dam) Dam y Dam Ide(Dam) y Ide(Dam) IUFRO Genomics and Forest Tree Genetics
Stage 3: Of the haplotypes that were declared as being significant remove nested haplotypes based on the individuals they contain and keep the haplotype length that has the largest number of animals. • This eliminates some double counting of haplotypes for an individual. Region 1 Region 2 1 2 3 4 5 6 7 8 1 2 3 4 5 6 7 8 9 10 11 Region 2 is nested within Region 1 IUFRO Genomics and Forest Tree Genetics
Unfavorable ROH Haplotype Finder Using simulated data I looked at the ability of the significant core haplotypes to tag unfavorable ROH stretches of various length. Individual 1 Individual 2 Individual 3 Individual 4 Individual 5 Core ROH • Using ten replicates calculated the average proportion of positive and negative true ROH effects for each significant core haplotype. IUFRO Genomics and Forest Tree Genetics
Founder Genomes • Randomly grab 2 haplotypes from each chromosome to create genotype. • No recombination to ensure when back-calculate sequence can go back to one complete haplotype. • Culling of Parents • Parents gets culled which is based on the culling parameter. • Culling based on: Random, Age, Phenotype, True Breeding Value or EBV based on pedigree or genomic. • Genetic Architecture • Set number QTL for each chromosome: • Quantitative QTL • Lethal QTL • Sub-lethal QTL • Threshold for QTL and Marker MAF threshold. • Markers spread evenly across chromosome. • Sample Location of QTL (Uniform(0,1) • Additive (Gamma ~(0.4,1.66) • Equal chance of being +/- • Dominance degrees (Normal ~(0.5,0.1) • Dominance Effect: Dominance Degrees * |Additive| • Majority + effect • Lethal and sub-lethal both derived from a gamma: • Lethal: Gamma (0.31,3.81) • Sets mean of S high and dominance is small • Sub-Lethal: Gamma (2.81,10.81) • Sets mean of S low and a moderate degree of dominance • Create Fake Marker Array (Marker can’t be QTL). • Scale Additive and Dominance Effects • New Mutations accumulate each generate and appear in the gamete. • Number follows a poisson (length * mutation rate) • Infinite Sites model: can only appear at location not already in SNP sequence data. • Only track Mutations that are tagged as having an effect. • Mutation has an equal chance of being a Quantitative or Fitness QTL. • Scaled using the same scaling factor in the founders. • Mating • Sire and Dams get randomly matched up and a given number of the sires gametes gets portioned to that dam. • Random Mating. • Gamete Formation • Crossovers simulated from Poisson distribution (1.0) and located with uniform distribution across the chromosome. • Number of Gametes per individual based on how many progeny expected to have. • Selection of Progeny • Selection of progeny animals to keep which is based on number of Sires and Dams and their culling levels • Selection based on: Random, Phenotype, True Breeding Value, EBV based on pedigree or genomic (set up MME). • Use Recursion to set up pedigree and genomic inverse and save already computed animals to reduce time. • Input Parameters • Animals that are available for selection are stored in the vector Animal Object and the following parameters impact how long an animal is available as a breeder: • Number of Sires and Dam per Generation • Sire and Dam culling • Maximum Age • Shape of Average Progeny Distribution • Class Objects • Animal Object: Stores information pertaining to each individual including: ID, Sire, Dam, Sex, Generation Born, Age Culled, Number of Progeny, Pedigree Inbreeding, Homozygosity, Phenotype, Genotypic Value, Residual, Markers and QTLs. • QTL Object: Stores information pertaining to each QTL including: Location, Additive Effect, Type, generation it appeared and the frequency by generation. IUFRO Genomics and Forest Tree Genetics
Founder Sequence • 5 Chromosomes (220, 180, 140, 100, 60 length Mb) • Ne 1000 (Villa-Angulo et al. 2009), Mutation Rate of 2.5 × 10 • QTL effects (Quantitative and Fitness). • 2500 Founders (Males ~1000 and Females ~1000). • 3000, 2000, 1500, 1000, 800 Markers by Chromosome. • Quantitative: 35 % Additive • 5 % Dominance • 60 % Environment 10X # Sires 100 # Dams = 800 # Quantitative QTL =500 # Lethal QTL 100 # SubLethal QTL 400 # Culling 30% (DRMS 2013) # New Mutations QTL 5% # Sires = 400 # Dams = 800 # Quantitative QTL =500 # Lethal QTL 400 # SubLethal QTL 100 # Culling 30% (DRMS 2013) # New Mutations QTL 5% # Sires = 100 # Dams = 800 # Quantitative QTL =500 # Lethal QTL 400 # SubLethal QTL 100 # Culling 30% (DRMS 2013) # New Mutations QTL 5% # Sires 400 # Dams = 800 # Quantitative QTL =500 # Lethal QTL 100 # SubLethal QTL 400 # Culling 30% (DRMS 2013) # New Mutations QTL 5% EBV Selection based on Pedigree Information for 40 Generations. IUFRO Genomics and Forest Tree Genetics
Generate Datasets of minimal (Ne2000), moderate (Ne250) and high (Ne100) LD and determine the haplotype finders effectiveness. IUFRO Genomics and Forest Tree Genetics
Acknowledgements People: • Jeremy Howard (NCSU) • J. Pryce (DEDJTR) • F. Tiezzi (NCSU) Funding: • Smithfield Premium Genetics • North Carolina Pork Council • The Maschhoffs • USDA NIFA • DEDJTR • National Pork Board IUFRO Genomics and Forest Tree Genetics