Download
1 / 78
780 likes | 805 Vues
The report provides an overview of the Columbia River Gorge Visibility Project, including findings, finances, phases, and studies. It discusses causes of visibility impairment, emission sources, and future steps.

E N D
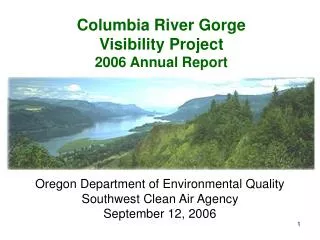
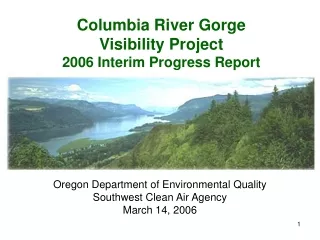
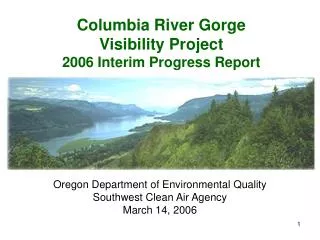
Columbia River Gorge Visibility Project 2006 Interim Progress Report Oregon Department of Environmental Quality Southwest Clean Air Agency March 14, 2006
Interim ReportColumbia River Gorge Visibility Project • Presentation Overview: • Project Overview • Final Haze Gradient Report. • Preliminary Findings from Draft Causes of Haze in the Gorge Report. • Other Programs that are On-line and Likely to Benefit Gorge Visibility. • Next Project Steps: • Public meeting tonight at Best Western Hood River Inn: 6:30 to 8:30 PM. • Model development, performance testing, draft and final modeling report to provide a glimpse into the future. • Some initial “What-if” questions answered. • Then, the Gorge Science Summary Report will summarize both the CoHaGo and Modeling reports and will also work on reconciling differences, if any, in the findings of the two prior reports. • In August 2007, we will provide the Commission an assessment and a plan. It is premature today to know what they will be.
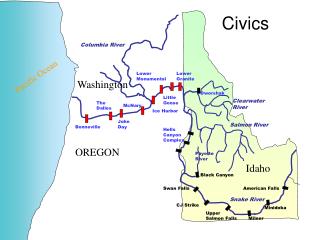
Interim ReportColumbia River Gorge Visibility Project • Project Background: • Technical Study Plan Mission: • Provide an assessment of the causes of visibility impairment in the Columbia River Gorge National Scenic Area; • Identify emission source regions, emission source categories, and individual emission sources significantly contributing to visibility impairment in the Gorge; • Provide predictive modeling tools or methods that will allow the evaluation of emission reduction strategies; • Provide an initial assessment of air quality benefits to the Gorge from upcoming state and federal air quality programs; and • Refine or adapt predictive modeling tools already being developed for visibility or other air quality programs, including but not limited to EPA’s Regional Haze Rule.
1990 2000 2001 2002 2003 2004 2005 2006 2007 2008 Interim ReportColumbia River Gorge Visibility Project Project Timeline: WDOE drops out of study and SWCAA absorbs additional workload Funding shortfall with $1.8 million and study scaled back to match available funds with emphasis on monitoring and modeling work DEQ, WDOE and SWCAA present Gorge Air Quality Technical Plan for $10 million study Wintertime and Summertime season comprehensive studies completed on-time. DEQ budget cuts. Draft Modeling Report in January with DEQ/SWCAA presentation to Gorge Commission in August WDOE/DEQ fund Haze Gradient Study IMPROVE monitoring data gathering (ongoing) Gorge Management Plan revised CoHaGo draft report issued and modeling contract executed
Interim ReportColumbia River Gorge Visibility Project • Project Finances: • Gorge studies initially funded by WDOE and DEQ at $223K • for Haze Gradient Study • 9 Nephelometers and meteorological stations in Gorge. • Minimum 1 year of concurrent data from all sites. • Final Haze Gradient Report issued January 2006. • Congressional funding of $670k in mid-2003 provided for additional • gaseous pollutant measurements and modeling to better understand • which pollutants contribute the most to visibility impairment. • Additional Congressional funding of $422k in mid-2004 provided monitoring for additional 6 months to get 1 year’s worth of data. • Additional funding of $205K from WA Legislature just received. WDOE can’t be used for FTE and still can’t re-engage at policy level. Meeting with SWCAA and DEQ.
Interim ReportColumbia River Gorge Visibility Project Project Phases: • Five phases to project approach: 1) Haze Gradient 2) Final Monitoring report (anticipated July 2006) • Computer Modeling report (anticipated early 2007) • Gorge Science Summary Report (anticipated Summer 2007) 5) SWCAA and DEQ policy assessment of results (anticipated August 2007) • Today’s update focuses on the Final Haze Gradient Report and the draft Causes of Haze in the Gorge (CoHaGo) Report. CoHaGo provides additional insights to Haze Gradient Study by including analysis of additional pollutants monitored such as sulfates, nitrates, sulfur dioxide, nitrogen dioxide, elemental carbon/organic carbon and IMPROVE particulate matter filter analysis. • Remember, CoHaGo findings are preliminary and need to be compared in Phase Four to the Phase Three modeling work.
Interim ReportColumbia River Gorge Visibility Project Project Studies: • What have we learned to date? • Confirmed that the Scenic Area has a complex environment • Confirmed that there are two distinct seasons with unique transition periods • Monitoring data provides general understanding of impairment processes • Monitoring data provides solid basis to evaluate model performance • Project is NOT complete. • Monitoring program is complete and provides opportunity to proceed with next phases of project: finalizing CoHaGo, modeling, reconciling CoHaGo and modeling, and Gorge Science Summary Report
Interim ReportColumbia River Gorge Visibility Project • Please remember the scope and funding for this project does not allow for a comprehensive and exhaustive evaluation of all air pollution effects. • However, this project will have more data and insight than any other study performed in the USA with the complex terrain and meteorology of the Gorge. • By working to improve visibility in the Gorge, we will both directly and indirectly benefit all the valued resources to be protected under the Scenic Area Act. • The following slide depicts the relative ranges of pollutant level impacts (e.g. human health), as you requested at our last presentation:
SO2 NO2 Interim ReportColumbia River Gorge Visibility Project Federal Stds. Particulate Public Health Impacts Federal Stds. Ozone Public Health Visibility Scenic Resource Impacts Acid Deposition Ecosystem Impacts Pollutant Level
Interim ReportColumbia River Gorge Visibility Project • Background Conclusion: • In August 2007, we will provide the Commission an assessment and a plan. It is premature today to know what they will be. It will include an analysis ofthe benefits expected from existing programs effecting the Gorge: • Regional Haze • Clean Air Mercury Rule • Clean Fuels and CAL-LEV • Mobile sources & heavy duty diesel engines • Smoke management/Outdoor Burning programs (WA & OR) • Reports on Project Web: www.gorgeair.org • www.swcleanair.org/reports.html • The project is on track, on schedule, and on budget!
Interim ReportColumbia River Gorge Visibility Project Part I. Final Haze Gradient Study Dr. Mark Green Dr. Jin Xu Division of Atmospheric Sciences Desert Research Institute
Interim ReportColumbia River Gorge Visibility Project Introduction: • Dr. Mark Green with Desert Research Institute (DRI) is the principal investigator and author for Haze Gradient Report and CoHaGo Report. • Nationally recognized expert in visibility issues. • Big Bend National Park visibility study (BRAVO). • Grand Canyon visibility study. • Under contract to EPA to perform analysis of visibility impairment in all Class I areas nationwide (CoHaz).
What Causes Haze? Interim ReportColumbia River Gorge Visibility Project • Haze is caused by scattering and absorption of light by particles and gases • Most haze is due to scattering of light by particles – sulfate, nitrate, dust, organic carbon compounds • Ammonia enables the formation of nitrate particles • Some haze caused by absorption of particles (elemental carbon or soot) • Scattering of light by air is natural
Interim ReportColumbia River Gorge Visibility Project Key Processes: • Haze Gradient Study • Causes of Haze in the Gorge analysis • Air quality modeling for selected episodes • Technical Team reviews • Overall program includes data analysis and modeling components – reconcile analysis and modeling results and subject all to peer-review • By the completion of the process have a better understanding and more confidence in results • Always some uncertainty in source contributions • Final conclusions await modeling and Gorge Science Summary Report.
Design of Haze Gradient Study: Interim ReportColumbia River Gorge Visibility Project • Measured the main portion of haze (scattering of light by particles or “bsp” or “haze”) with nephelometers at 9 sites within, and outside the gorge, on each end • Measured at several sites near river level and sites well above river levels to look at vertical and horizontal gradients of haze and how they vary diurnally and seasonally • Measured wind speed and direction, temperature and relative humidity at nephelometer sites to relate wind speed and direction to haze levels • Field study from July 2003 through February 2005
Haze Gradient Purpose: Interim ReportColumbia River Gorge Visibility Project • Whether haze is from sources west of the Gorge, east of the Gorge, or within the Gorge • Understand how these general source areas affect the Gorge under different weather conditions and seasons • Cannot tell much about specific sources without chemical component data • Haze Gradient Study provides a good foundation for more source specific study in CoHaGo
Interim ReportColumbia River Gorge Visibility Project Summary of Haze Gradient Study Findings: • Haziest pattern with winter Downgorge (easterly) flow – sources east of Gorge mainly responsible • Summer patterns – see increased haze as Portland metro area emissions transported through gorge (seen mostly western-central gorge – eastern Gorge much cleaner due to dispersion) • Light Downgorge – see increase in haze across The Dalles as winds shift from westerly to easterly
Western Gorge Sites: Sauvie Island, Steigerwald, Mt. Zion, & Strunk Rd.
Central Gorge Sites: Bonneville Dam, Memaloose State Park, & Sevenmile Hill
Eastern Gorge Sites: Memaloose State Park, Sevenmile Hill, Wishram, & Towal Rd.
Frequency of Wind Direction 2 Main Directions: Upgorge and Downgorge
Interim ReportColumbia River Gorge Visibility Project Analysis Methodology: • Too much information to try to describe all 600 days of data, 24 hours per day • Use wind data to form groups of days with similar spatial and diurnal wind field patterns (cluster analysis) • Used hourly component of the wind along Gorge axis • Compute typical spatial and diurnally varying wind field patterns for each cluster (group of similar days) • Compute and study light scattering (bsp) patterns for each group of similar days • Also computed pressure patterns for each cluster to better understand wind field patterns (in the Gorge winds blow from high to low pressure)
Interim ReportColumbia River Gorge Visibility Project Typical Wind Patterns: • Five clusters of similar days were identified: 1) Light Upgorge flow, 2) Moderate Upgorge flow, 3) Strong Upgorge flow, 4) Light Downgorge flow (diurnal reversal at eastern sites), and 5) Winter Downgorge flow (light at east end, strong at west end).
Interim ReportColumbia River Gorge Visibility Project Seasonality of Wind Patterns: 1) Light Upgorge: transitional – April and October peaks 2) Moderate Upgorge: late summer/early fall – peak in frequency 3) Strong Upgorge: main summer pattern – July peak frequency 4) Light Downgorge: transitional – April and November peaks 5) Winter Downgorge: main winter pattern, never occurred in summer
Daily Average Upgorge (west to east) Wind at Each Site by Wind Pattern (Cluster)
Diurnal Variation of Winds by Cluster for a Western, Central, and Eastern Site
Interim ReportColumbia River Gorge Visibility Project Summary of Haze by Wind Pattern Type: • Winter Downgorge highest average light scattering at all sites except Steigerwald and Sauvie Island (eastern sites haziest) • All sites strong Upgorge lowest light scattering (and large gradient from west to east) • So main summer pattern cleanest; main winter pattern dirtiest • Sauvie Island and eastern Gorge sites have greater variation between patterns than other sites • Days with precipitation generally have lower light scattering than days without precipitation
Decrease in Haze Downriver to Steigerwald Increase Across Portland Metro Area to Sauvie Is.
Light Downgorge has Flow Reversal at Sevenmile Hill, Wishram, Towal Road. As Wind Changes from Westerly to Easterly at Sevenmile Hill, Haze Increases
Wind Shift Followed by Increase of Haze at Memaloose Compared to Wishram (4-6 Mm-1) Increase Across The Dalles
Increase in Haze Gradually Works Eastward Through Gorge as Westerly Winds Transport “Slug” of Hazy Air from Portland Metro Area
Interim ReportColumbia River Gorge Visibility Project Recap of Haze Gradient Study Findings: • Haziest pattern with winter Downgorge (easterly) flow – sources east of Gorge mainly responsible • Summer patterns – see increased haze as Portland metro area emissions transported through gorge (seen mostly western-central gorge – eastern Gorge much cleaner due to dispersion) • Light Downgorge – see increase in haze across The Dalles as winds shift from westerly to easterly
Interim ReportColumbia River Gorge Visibility Project Part II. Causes of Haze in the Gorge (CoHaGo) Draft Report Dr. Mark Green Dr. Jin Xu Division of Atmospheric Sciences Desert Research Institute
Interim ReportColumbia River Gorge Visibility Project Purpose of CoHaGo Study? • Haze gradient study answered questions about spatial patterns of haze and how they relate to wind directions and seasons. It gives insight into general source areas, but not source types of haze. • CoHaGo, with its expanded chemical component data, was done to help understand source types responsible for haze. • If we know source types and direction the haze is coming from, we can say something about which individual sources are likely to be contributing significantly to haze.
Interim ReportColumbia River Gorge Visibility Project CoHaGo Approach: • First, review and quality assure all data used. • Compare measurements of same compounds using different instruments (such as high-time resolved sulfate and 24-hour averaged sulfate). • Summarize chemical and optical measurements and look at average differences along the Gorge in terms of chemical components responsible for haze. • Perform receptor modeling analysis (PMF) to assess impacts from each source type identified from the chemical data. • Perform case study analysis to help understand causes of haze for worst winter and worst summer episodes. • Will compare with source modeling results to be obtained later. Part of Gorge Science Summary Report.
Interim ReportColumbia River Gorge Visibility Project Preliminary Findings of Draft CoHaGo Study: • Summertime haze mainly organics and sulfate – organics mainly burning • Sulfate variety of sources, specifically including oil combustion (shipping), paper mill • Portland Metro area contributing significantly in summer • Wintertime haze worse than summer – nitrates, sulfates, and organics – sources mainly from the east • Wood burning, Columbia River Basin cities, and Boardman power plant probable contributors to winter haze • Some impact of The Dalles noted under certain conditions • These findings will be further analyzed using existing source profiles in project’s next phases: modeling and Summary Report.
Summary of Preliminary Results Wishram Mt Zion Organic carbon, sulfate, and nitrate in eastern Gorge. Organic carbon and sulfate, then nitrate are the biggest contributors to haze in western Gorge.
Western Gorge (Mt. Zion) 8 Source Factors Identified Eastern Gorge (Wishram) 6 Source Factors Identified
Summary of Episode Analyses: November 2004: Flow from the east – biomass burning and nitrate-rich secondary with sulfate important (home heating/electricity generation)? February 2004: Flow from the east – nitrate rich and sulfate rich secondary – electricity generation? August 2004: Light westerly flow – regionally high OC (fires) more locally high sulfate. July 2004: Light westerly flow – high regional OC (fires), locally enhanced sulfate due to paper mill. Interim ReportColumbia River Gorge Visibility Project
Interim ReportColumbia River Gorge Visibility Project Enhanced Measurements: • Enhanced measurements made for 2 winter periods and one summer-fall period: (12/1/03 - 2/28/04, 12/1/04 -2/28/05, and 7/1/04 -11/30/04) • Added instruments remained at Bonneville. All episodes and another set moved from east end (Wishram) to west end (Mt. Zion) for summer - fall, then back to Wishram for 2nd winter • Main instrumentation added high-time resolved sulfate, nitrate, organic and elemental carbon. Size resolved (DRUM) aerosol data • Also additional 24-hour filter samplers at Sauvie Island (summer) and Towal Road (winter)
Interim ReportColumbia River Gorge Visibility Project Positive Matrix Factorization (PMF): • PMF is a statistical method that extracts “factors” from chemical composition data. • The various factors are profiles that give the ratio of chemical elements to each other. These are extracted from the measured data and can then be compared to profiles from sources, as available. • Ideally, the factors represent specific sources or source types. In reality, different source types sometimes get mixed together in a factor. • By using wind direction and other information, we can get better confidence in the results and more specificity, at least regarding direction of sources.
Interim ReportColumbia River Gorge Visibility Project PMF: • The output is the profile of each factor (abundance of each chemical element) and a weighing of each factor for each measurement period. • This output lets us attribute each source type for a share of the particles and haze. • PMF was applied to data from Wishram and Mt. Zion for the years 2003 – 2004. These are the only sites in the Gorge with sufficient data for this method.
Interim ReportColumbia River Gorge Visibility Project PMF Results – “Markers” at Mt. Zion: • 7 “factors” identified at Mt. Zion: • Paper mill: rich in Na, K, and Cl • Oil Combustion: excess V, Ni • Biomass smoke: high in OC, EC, K • Secondary sulfate • Secondary nitrate • Mobile: high EC, Zn • Dust: high in Si, Ca, Fe, K
Mt. Zion’s 7 Source Profiles
Average Contribution of Each PMF Factor to PM2.5 Mass at Mt. Zion