Download
1 / 80
800 likes | 976 Vues
CLASSIFICATION OF MESOSCALE SNOW BANDS IN THE NORTHEAST UNITED STATES. Norman Shippee Plymouth State University. Overview. Objectives Background Data and methodology Results Synoptic Composites Predictors from composite analysis Conclusions Suggestions for future work Questions.

E N D
CLASSIFICATION OF MESOSCALE SNOW BANDS IN THE NORTHEAST UNITED STATES. Norman Shippee Plymouth State University
Overview • Objectives • Background • Data and methodology • Results • Synoptic Composites • Predictors from composite analysis • Conclusions • Suggestions for future work • Questions
Objectives • Classify types of mesoscale snow banding in winter storms occurring in the Northeast. • Utilize independent predictors, such as topographic data and local meteorological features, to predict the type and location of mesoscale banding (if any) before it occurs.
Objectives • Develop a climatology of snow banding events in the domain based upon banding type
Objectives • Develop a climatology of snow banding events in the domain based upon banding type • Create composites to attempt to distinguish synoptic differences between banding classes
Objectives • Develop a climatology of snow banding events in the domain based upon banding type • Create composites to attempt to distinguish synoptic differences between banding classes • Use predictors to attempt to predict the type of band and location such as: • Existence of a Coastal Front • Cross-shore θ gradient • Cross-shore topographic slope • Topographic height • Frontogenesis
Background • Areas of heavier precipitation embedded in winter storms. • These areas are localized, and result from mesoscale banding. • Can cause extreme rates of snowfall in a small area (1-3 inches per hour or more)
Background • Many studies on mesoscale snow-banding have been conducted • Mesoscale snow-banding is often handled poorly by conventional numerical modeling • Beyond 12 hours, forecasts of predictors for mesoscale banding are degraded
Background • Mesoscale banding occurs in approximately 85% of cyclones impacting the Northeast in the winter months • Important to understand and predict where and when banding might occur, along with how much snow might fall
Background – Snowfall Forecasting • Current methods describe the two-fold approach to forecasting snowfall depth • QPF Snow amount conversion • 10 inches of snow to 1 inch of QPF (10:1)
Background – Snowfall Forecasting • Current methods describe the two-fold approach to forecasting snowfall depth • QPF Snow amount conversion • 10 inches of snow to 1 inch of QPF (10:1) • Problems exist with this method • Rule was developed in 1888 • “Rule of thumb” • Misses range of density changes of snowfall • Could be seen as a hindrance to snowfall forecasts
Background - Ingredients • Primary ingredients needed for heavy, banded snowfall are: • Frontogenesis • Weak moist symmetric stability • Moisture • Cloud microphysics (less important) • Variables often are coupled in studies
Background – Model Forecasts • Both the GFS and the NAM do a poor job predicting mesoscale bands of heavy QPF (Jurewicz and Evans 2009). • Models often provide a good forecast of the potential predictors for mesoscale snow banding events up to 12 hours prior to onset. • Beyond 12 hours, model forecasts of the predictors is also degraded.
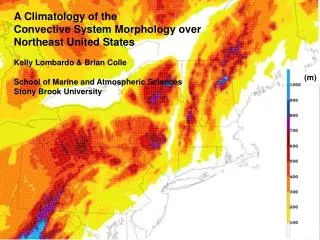
Background – Observing Using Radar • When viewing radar images, most mesoscale banding reflectivity returns fall within a range of reflectivities • 25-35 dBZ • Over 35 dBZ, there is potential for observation of bright banding
Background – Banding Classes • Banding classification scheme adopted from a paper by Novak et al (2004) • Single Band: 20-100 km in width, >250 km in length, >30 dBZ for 2 hr minimum
Background – Banding Classes • Single Banded example:
Background – Banding Classes • Single Banded example:
Background – Banding Classes • Banding classification scheme was adopted from a paper by Novak et al (2004) • Single Band: 20-100 km in width, >250 km in length, >30 dBZ for 2 hr minimum • Multi-Band: >3 finescale bands (5-20 in width) with periodic spacing and intensities >10 dBZ over background reflectivity
Background – Banding Classes • Multi-banded example:
Background – Banding Classes • Banding classification scheme was adopted from a paper by Novak et al (2004) • Single Band: 20-100 km in width, >250 km in length, >30 dBZ for 2 hr minimum • Multi-Band: >3 finescale bands (5-20 in width) with periodic spacing and intensities >10 dBZ over background reflectivity • Non-Banded: Meets no criteria; disorganized
Data & Methodology • Needed a starting point: Satellite data • Satellite images used to ID potential storms during winter months using the NCDC GIBBS Satellite Archive • Storms needed to be of “synoptic scale” on the satellite image • At least 1000 km in one dimension (Holton 2006) • This method did not identify banding events, just potential storms
Data & Methodology • Satellite time resolution was important • Storm could not make large jumps into or out of study domain • Minimum temporal resolution available: 3 hr • Typical synoptic storm can cover ~1200 km per day (Pidwirny 2006) • ~150 km in 3 hrs • Reasonable for the study domain size
Data & Methodology • Analyzed storms from the winter months (November to March) for the years of 2004 to 2009 • Storms used in this study met 24-hr snowfall warning criteria for the most southern parts of the study domain • 8 inches in 24 hours at 2 or more stations
Data & Methodology • After utilizing satellite images to ID potential storms, NCDC snowfall reports and decoded surface METAR reports were analyzed for 2 things • Total 24-hr snowfall depth change • Consecutive hours of snowfall (2 hr minimum, allow for 1 hr break)
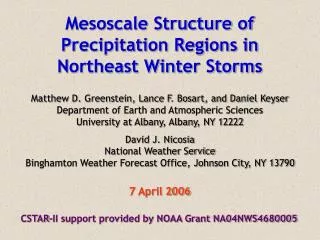
Data & Methodology – Gridding Data • Necessary to create a gridded domain for the study to utilize numerical model data and radar data • The gridded area was defined as roughly Pennsylvania to Maine and rotated 45 degrees to align with the axis of the Appalachian Mountains
Data & Methodology – Gridding Data • Data were gridded on a 20 km by 20 km square grid extending from Western Pennsylvania northeastward to Maine • Grid spacing chosen in order to capture the short axis scale of a small single-band event • ~20 KM (Novak et al 2004)
Data & Methodology - Classification • Banding identification was performed by radar imagery using WSI NOWRAD generated from the NCAR archives • Storms were classified into three classes described before: • Single-Banded • Multi-Banded • Non-Banded
Data & Methodology • Gridding topography data • Used the ETOPO1 dataset with horizontal resolution of 1arc-minute • Data were gridded to the 20 km spacing using a series of scripts • Greatest topographic height within a 12.071 km radial sweep of each point was assigned to the corresponding grid point
Data & Methodology • NCDC Radar data were also downscaled from high resolution data to the 20 X 20 km grid • Needed for regression analysis • Used maximum value within a box around each grid point to eliminate overlap • Different than the topographic height interpolation
Summary of Data Sources • Topographic data : NGDC ETOPO1 dataset • Satellite images: GIBBS satellite archive, available online at http://www.ncdc.noaa.gov/gibbs. • Radar data: National Climatic Data Center (NCDC) repository of NEXRAD radar data and WSI NOWRAD imagery from UCAR • Numerical model data: NARR-A 25 km resolution dataset. • Snowfall data: METAR and NCDC reports
Objectives • Develop a climatology of snow banding events in the domain based upon banding type • Create composites to attempt to distinguish synoptic differences between banding classes • Use predictors to attempt to predict the type of band and location such as: • Existence of a Coastal Front • Cross-shore θ gradient • Cross-shore topographic slope • Topographic height • Frontogenesis
Results - Climatology • Single banding events dominate all events observed in the study period with 20 out of 35 (57%) of all cases • Multi-banding events were observed in 9 out of 35 cases (26%) • Non-banded storms comprised 6 out of 35 cases (17%) • Overall, 83% of cases exhibited a type of banding
Results - Climatology • Single banded events: • More dominant overall • There is a steady progression of more single banded events in the colder months, to less single banded events in the warmer months.
Results - Climatology • Single banded events: • More dominant overall • There is a steady progression of more single banded events in the colder months, to less single banded events in the warmer months. • Multi-banded events: • Similar progression • A peak of total number of events in the months of January and February
Results - Climatology • Single banded events: • More dominant overall • There is a steady progression of more single banded events in the colder months, to less single banded events in the warmer months. • Multi-banded events: • Similar progression • A peak of total number of events in the months of January and February • Non-banded events: • Least dominant • Smallest number of total events; one or two over the 5 year period in each month; none in November
Objectives • Develop a climatology of snow banding events in the domain based upon banding type • Create composites to attempt to distinguish synoptic differences between banding classes • Use predictors to attempt to predict the type of band and location such as: • Existence of a Coastal Front • Cross-shore θ gradient • Cross-shore topographic slope • Topographic height • Frontogenesis
Synoptic Composites • Synoptic composites were constructed using the NCEP/NCAR Reanalysis to analyze the potential differences in synoptic setup based upon the type of banding produced by each storm • The three classes for composite analysis: • Single banded • Multi-banded • Non-banded
Composites – Non-Banded Storms Sea Level Pressure for non-banded events
Composites – Non-Banded Storms 700mb Omega for non-banded events
Composites – Non-Banded Storms 500 hPa height for non-banded events
Composites – Non-Banded Storms 250 hPa zonal wind for non-banded events
Composites – Single Banded Storms L Sea Level Pressure for single banded events
Composites – Single Banded Storms 700 hPa omega for single banded events
Composites – Single Banded Storms 500 hPa height for single banded events