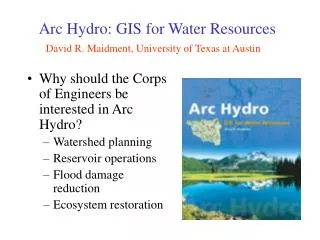
GIS Resources For Journalists
GIS Resources For Journalists. Outline. What is GIS? Why use GIS? How are journalists u sing GIS? Data driven journalism What do you need to make and share maps Data Software Online Apps Some coding skills (python, html). What does GIS stand for?. G eographic I nformation S ystems

GIS Resources For Journalists
E N D
Presentation Transcript
Outline • What is GIS? • Why use GIS? • How are journalists using GIS? • Data driven journalism • What do you need to make and share maps • Data • Software • Online Apps • Some coding skills (python, html)
What does GIS stand for? • Geographic Information Systems • often defined as a computerized database management system for capture, storage, retrieval, analysis, and display of spatial data. - www.cml.upenn.edu/what_is_gis.htm • allows the user to create visual displays using tabular information.
GIS is in reality nothing more than a large database with a geographic component. The power behind GIS is in the attributes attached to the features...allows for more complex analysis based on more than just geographic location.
How GIS works • GIS breaks anything that has a geographic location into: • Vector Data: • Points - GPS points, address points, treeocations, etc. • Lines – rivers, railroads, streets, corridors, etc. • Polygons – political boundaries, lakes, building footprints, etc. Image Source: www.esri.com 2013
Why Use GIS/Maps • Layer the different datasets to do geographic analysis (analysis based on geographic location) • Map Where Things Are – Where is the Ukraine located? • Map Quantities – The total number of acres devoted to coal mining in the state of West Virginia. • Map Densities - Population per square mile. • Find What’s Inside - How many historic homes are located within a proposed neighborhood rehabilitation zone. • Find What’s Nearby - How many parks/recreation areas are there within a ¼ mile from my house? • Map Change – Urban Sprawl, Rainforest depletion Source: www.esri.com 2013
Random GIS Fact • In 1854 Dr. John Snow analyzed geographic data to determine the source of a cholera epidemic in London. • The earliest recorded uses of Geographic Information techniques • The source was a contaminated well.
First, You need:1. data (your own or someone else’s)2. software to filter and map complexdata3. apps to visualizeand share the map with others Making a Map
Data • What makes data “spatial”? • Must have a geographic component • Address • Lat/Long coordinates • Tied to a location such as a state, city, region, service area, census block. • When should you create and share maps of your data? • Only if it enhances the data and makes it easier for users to understand and comprehend!! • A picture is worth a thousand words!
Maps need base or “reference” data • helps those viewing the maps figure out exactly what and where they are looking at. • Orthophotography • Streams • Watershed Boundaries • Jurisdictional Boundaries • Streets • …..and many more datasets, such as parcels, zoning boundaries, contours, soils, etc. Source: www.esri.com 2013
Your data • GPS points • Georeferencing - a historic map or image • Geocoding addresses • Heads-up-digitizing • Analysis Tools with GIS Software • Mobile Mapping – cellphones, tablets • Upload from a database (Excel, Access, etc.) • Stream from Twitter or other social media
Government data sources • Data.gov • ARDA – the association of Religion Data Archives • Census.gov • CIA World Factbook • Eurostat • Global Health Observatory • Harvard Dataverse Network • HUD.gov • International Monetary Fund (IMF) Data • NOAA • IndianaMap (or other state GIS data collection) • UNdata – United Nations Statistics Division • Community Commons
You can use a GIS Software Program or Online Applications.The number of options is daunting! You have data, now to analyze and create the map…
Quantum GIS (QGIS) • Open Source GIS- which means FREE! • Runs on Linux, Unix, Mac OSX, Windows and Android. PostGIS • Adds spatial support to the PostgreSQL database program. • Allows you to write queries based on Geographic location. • QGIS can connect to a PostGIS database for viewing and editing free of charge.
Map Maker • Map Maker Gratis – free GIS for Windows • Fully functional map production program • Doesn’t have an online map sharing component • http://www.mapmaker.com/v3/products.htm
Google Maps http://www.walkscore.com/score/94043
Google Earth http://www.brocku.ca/maplibrary/digital/War1812/WarOf1812.php
Tableau Public • Free data visualization tool • http://www.tableausoftware.com/public/gallery
MapBox • Powered by Open StreetMap • Foursquare • Evernote • Financial Times • Pinterest http://www.mapbox.com/showcase/ Source:mapbox.com/showcase, 2013
ArcGIS Online http://storymaps.arcgis.com/en/ http://storymaps.esri.com/stories/2014/womeningis/ Source: www.esri.com 2013
ESRICommunity Analyst and BAO http://www.esri.com/software/bao/reports-maps/bao-variables Source: www.esri.com 2013
QUESTIONS? Contact: Angela Gibson GIS Specialist University Libraries GRMC (BL224) asgibson2@bsu.edu 285-1097