Download
1 / 43
430 likes | 500 Vues
An annual benchmark report detailing Orange County's current status in educational achievement, employment projections, industry trends, and workforce housing. Explore data on demographics, dropout rates, graduation rates, industry clusters, housing costs, and economic indicators to aid decision-making. Visit www.OCEconomy.org for more information.

E N D
Provide an annual “State of the County” benchmark of where the region is currently in terms of: Educational achievement of our students; Wages and employment projections of growth occupations; The growth trends and changes taking place in our key industry clusters; and Our ability to provide housing for our workforce. 2009 Orange County Workforce Indicators
Orange County Business Council Mission and Core Initiatives OCBC represents and promotes the business community, working with government and academia, to enhance Orange County’s economic development and prosperity in order to preserve a high quality of life. Workforce Housing Workforce Development Infrastructure Economic Development
Are Demographics Destiny? Projected Ethnicity in OC 2000-2050
Workforce Supply: High Schools and Colleges Language Acquisition Dropout Prevention Achievement • College Prep • STEM focus
English Learners 2009 Orange County Compared 21.8% 22.7% 24.2% 24.8% 27.2% 27.9%
Orange County English Learners by School District 2009 56.1% 46.5% 27.9% 26.5% 24.5% 23.8% 24% 13.9% 13.8% 12.4% 11.8% 13.1% 11% 10.1% 3.2% 2.7%
Adjusted Grade 9-12 Four Year Derived Drop-Out Rate, 2007 & 2008 26.3% 24.2% 22.3% 20.3% 20.4% 21.1% 17.1% 22.5% 21% 15.7% 20.8% 17.1% 17.3% 18.9% 16.7% 10.9% 14.4% 10%
Orange County Drop-Out Rate 2008 23.9% 17.2% 18.9% 16.0% 14.2% 10.9% 9.4% 6.5% 4.5% 3.8%
Orange County Graduation Rate 56.1% 94 92 93 89 90 83 80 81 83 76 75 73 68 61 60 47
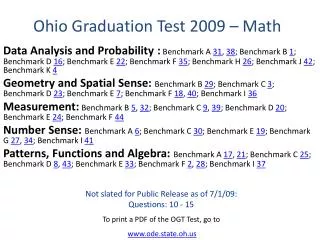
Orange County High School Exit Exam Trend, 2001-2009 87% 86% 83% 82% 73% 70% 86% 71% 72% 83% 85% 81% 63% 72% 69% 54% 53% 43%
% of Population (25 or older) without a High School Diploma, 2007 % of Population (25 or older) with a Bachelor’s Degree or Higher
UC/CSU Eligible Graduates, Comparison to State, 2007-2008 67% 59% 52.4% 48.4% 45.4% 40.9% 38.8% 44.5% 36.9% 33.3% 24.3% 28.2% 22.2% 30.8% 24.1% 26.3% 22.6%
AP STEM Enrollment 2009 Orange County Compared
Grade 11 Math and Sciences “Advanced or Proficient,” 2003-2009
Orange County Industry & Occupation Indicators Location Quotients/Industry Concentration Industry Growth Projections for OC Cluster Analysis Analysis of Occupations
OC’s Top 10 “Competitive Edge” Private Industries by Location Quotient
Top 20 OC Industry Sectors with Highest Location Quotients in 2007 *Red-font numbers indicate a decline in location quotient from 1990 to 2007. *Green-font numbers indicate an increase in location quotient from 1990 to 2007.
Top 10 Fastest Growing Industries in Orange County, Absolute Growth Next 10 Years
Top 10 Industries in Orange County % Percentage Job Growth Next 10 Years
Top 10 Fastest Growing Occupations in OC by Absolute Growth, 2006-2016
Top 10 Fastest Growing Occupations in Orange County by % Growth, 2006-2016 51.8% 46% 45.5% 45.5% 44.7% 40.7% 39.3% 39.1% 38.1% 36.5%
Orange County Housing Cost: A Workforce Perspective Home Purchasing and Rental Affordability
2009 Hourly Wage Need to Afford Fair Market Rent, Orange County Compared
Enable policy makers to make decisions in response to changing economic conditions 2007-2009 Recession Financial Crisis 2008-09 Housing Price Collapse Changing National and Global Economic Competition Evolving Technology OC Economic Indicators Dashboard – www.oceconomy.org
Cal State Fullerton’s Orange County Business Expectations Index
Chapman’s California Consumer Sentiment Index: Optimistic = > 100
Chapman’s California Consumer Sentiment Index: Optimistic = > 100
Orange County Business Council www.ocbc.org www.ocwib.org