Ohio Graduation Test 2009 – Math
Ohio Graduation Test 2009 – Math. Data Analysis and Probability : Benchmark A 31 , 38 ; Benchmark B 1 ; Benchmark D 16 ; Benchmark E 22 ; Benchmark F 35 ; Benchmark H 26 ; Benchmark J 42 ; Benchmark K 4

Ohio Graduation Test 2009 – Math
E N D
Presentation Transcript
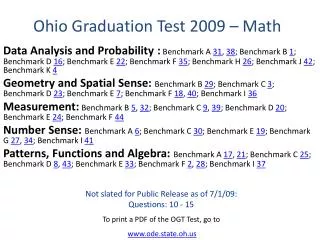
Ohio Graduation Test 2009 – Math Data Analysis and Probability: Benchmark A 31, 38; Benchmark B 1; Benchmark D 16; Benchmark E 22; Benchmark F 35; Benchmark H 26; Benchmark J 42; Benchmark K 4 Geometry and Spatial Sense: Benchmark B 29; Benchmark C 3; Benchmark D 23; Benchmark E 7; Benchmark F 18, 40; Benchmark I 36 Measurement: Benchmark B 5, 32; Benchmark C 9, 39; Benchmark D 20; Benchmark E 24; Benchmark F 44 Number Sense: Benchmark A 6; Benchmark C 30; Benchmark E 19; Benchmark G 27, 34; Benchmark I 41 Patterns, Functions and Algebra: Benchmark A 17, 21; Benchmark C 25; Benchmark D 8, 43; Benchmark E 33; Benchmark F 2, 28; Benchmark I 37 Not slated for Public Release as of 7/1/09: Questions: 10 - 15 To print a PDF of the OGT Test, go to www.ode.state.oh.us
1. A mother is keeping a record of how her new baby’s weight changes as the baby grows. The mother’s record is shown in the table below. What type of graph should she use to show how the baby’s weight changed over time? A. line graph B. histogram C. circle graph D. box-and-whisker plot index
2. Jill charges a base rate of $25 per lawn plus $18 for each hour she mows the lawn. Which equation gives the amount of money, m, Jillearns from mowing a lawn for h hours? A. m = 25h + 18 B. m = 18h + 25 C. m =h – 18 25 D. m =h – 25 18 index
3. In which figure is the measure of ∠1 equal to 45o? • Picture Choice 1 • Picture Choice 2 • Picture Choice 3 • Picture Choice 4 2. 4. 3. 1. index
4. Leroy has a number cube with sides labeled 1 through 6. He tosses the number cube 4 times. Each toss results in a 5. What is the likelihood that the next toss will result in a 5? • 1/1 • 1/4 • 1/5 • 1/6 index
5. For lunch Fanya drank a can of cola that had a diameter of 2 inches and a height of 5 inches. After school, she drank a can of juice that measures twice the diameter and twice the height of the can of cola.Find the volume of each can. Show work or provide an explanation to support your answers. Determine how many times larger the volume of the juice can is than the volume of the cola can. (2 points) Write the answer on separate paper. Scoring Guidelines index
6. A virus measures 0.000022 mm in length.Which value expresses the length of the virus in scientific notation? A. 2.2 × 10⁻⁴ mm B. 2.2 × 10⁻⁵ mm C. 2.2 × 10⁻⁶ mm D. 2.2 × 10⁻⁷ mm index
7. This net is folded to produce a three-dimensional object. Which object will this net produce? • Picture Choice 1 • Picture Choice 2 • Picture Choice 3 • Picture Choice 4 3. 4. 2. 1. index
8. At the beginning of the day, the owner of arestaurant opens a new case of take-out boxes. One case holds 500 take-out boxes. He uses an average of 35 take-out boxes each day. Based on his average usage, which expression represents the number of take-out boxes that remain d days after the new case of boxes isopened? A. 500 – 35d B. 500 + 35d C. 500d – 35 D. 500d + 35 index
9. The diagram shows a hexagon drawn inside a rectangle. What is the area of the hexagon? A. 21 cm2 B. 24 cm2 C. 30 cm2 D. 54 cm2 index
16. Tonya and her friends earned extra money by mowing lawns around their neighborhood. Tonya created a table to show their earnings. Pedro noticed that Tonya made a mistake. His earnings were $24, not $8. How does this change affect the mean of the group’s earnings? A. The mean remains the same. B. The mean increases by $2.00. C. The mean increases by $3.00. D. The mean decreases by $9.00. index
17. A pattern of shaded and unshaded squares is shown below. Find a formula for or describe in words the number of shaded squares in the nth figure. Find the number of shaded squares in the 50th figure. Show your work or explain your answer. (2 points) Write the answer on separate paper. Scoring Guidelines index
18. Trapezoid RSTU is shown on the grid. Which graph shows the image of trapezoid RSTU after it is translated 5 units up and 3 units to the left? • Picture Choice 1 • Picture Choice 2 • Picture Choice 3 • Picture Choice 4 3. 2. 1. 4. index
19. Four numbers are shown.31/4 , 7 5/8 , √50, 7.82Which shows these numbers ordered from least to greatest? A. 7 5/8 , 31/4 , 7.82, √50 B. √50, 7.82,31/4 , 7 5/8 C. √50, 75/8 ,31/4 , 7.82 D. 31/4,√50 , 7 5/8 , 7.82 index
20. Zack is packing for a trip to Scotland. He read that the average temperature in the summer is 18oC during the day and 7oC during the night.(F = 9/5 C + 32)What is the difference between the high and low temperatures in degrees Fahrenheit? A. 19.8oF B. 43.0oF C. 51.8oF D. 77.4oF index
21. A grocery store has a triangular pyramid of soup cans on display. Steven counts the number of cans in each of the top five layers. Each successive layer continues following the same pattern. The display has 10 layers. How many cans are in the 10th layer? A. 25 B. 30 C. 45 D. 55 index
22. Local residents have requested a traffic light at the intersection of Polk Road and Vine Street. They claim that the intersection has become unsafe for their children due to the high volume of drivers using these roads as shortcuts during rush hour from 4 p.m. to 6 p.m. In response, the street department installed a device that would count cars going through the intersection. The device counted the total number of cars each day for a two-week period. The department used the results to determine the average number of cars passing through the intersection each day. They decided the number was normal for an intersection with no light, and refused the residents’ request. Explain how the residents can claim that the method the department used to collect the data does not provide valid information for evaluating their request. Explain how the department’s method can be altered to provide more valid data. (2 points) Write the answer on separate paper. Scoring Guidelines index
23. Points Q, R, and W are plotted on the coordinategrid. Where should point Z be plotted so thatparallelogram QRWZ is formed? A. (–2, –6) B. (–1, –3) C. (3, –2) D. (2, –1) index
24. A manufacturer wants to make a rectangularstorage box with volume 0.75 cubic meters, length 1.5 meters, and width 0.4 meters.What is the height of this box? A. 0.15 m B. 0.45 m C. 0.80 m D. 1.25 m index
25. Kim is selling sandwiches for a school fundraiser. She made the chart below to help her with pricing. Which function represents the cost of the sandwiches? A. f(x) = 1.15x B. f(x) = 3.45x C. f(x) = 1.15x + 3.45 D. f(x) = x2 + 1.15x – 9 index
26. A banquet center offers a choice of 3 salads, 5 main courses and 4 desserts. How many different meals can be created by selecting one salad, one main course and one dessert? A. 12 B. 20 C. 35 D. 60 index
27. Joel has a 50-meter roll of copper wire thatweighs 7.5 kilograms. Approximately howmany meters of wire will be in a new shipmentthat weighs 502.5 kilograms? A. 75 m B. 610 m C. 3,350 m D. 3,770 m index
28. Frank makes and sells small picture frames. Hisrevenue from sales can be represented as R = $13.60x for x frames sold. The cost of making the frames can be represented as C = $5.80x + $120 for x frames made. Determine the minimum number of frames Frank must make and sell in order for his revenue to be greater than his costs. Show your work or provide an explanation for your answer. (2 points) Write the answer on separate paper. Scoring Guidelines index
29. Similar trapezoids are shown.What is the value of n? A. 10 B. 12 C. 15 D. 19 index
30. The value of x is even, and the value of y is odd.Which expression will produce an even number? A. x + 2y B. 2x + y C. x2 + y2 D. (x + y)2 index
31. The bar graph shows the number of customers inRio’s restaurant each day last week. What is the approximate mean number of customers per day in Rio’s restaurant last week? A. 360 B. 400 C. 440 D. 500 index
32. Mitchell is planting tulip bulbs in a rectangular planter with the dimensions shown. Mitchell plans to fill 3/4 of the planter with soil. How much soil will Mitchell need? A. 1,188 cubic inches B. 1,584 cubic inches C. 2,107 cubic inches D. 11,880 cubic inches index
33. When a car travels at a constant rate, distance varies directly with time. Which graph could represent the distance as a function of time? • Picture Choice 1 • Picture Choice 2 • Picture Choice 3 • Picture Choice 4 1. 4. 2. 3. index
34. The employees of a company will vote on two options for pay increases. The first option states that each employee will receive a $500 raise; the second option states that each employee will receive a 2% raise. The table shows the annual salaries of the employees of the company. Determine which option is likely to receive the most votes. Support your response by comparing the effects of each option on the given salaries. (4 points) Write the answer on separate paper. Scoring Guidelines index
35. A town census was conducted every year for the past 10 years. The scatterplot below shows the results of the census. If the linear trend continues, which prediction is supported by the data? A. The population will stay the same for the next 5 years. B. The population will reach 120,000 within the next 10 years. C. The population will decline steadily over the next 10 years. D. The population will exceed 50,000 people within the next 5 years. index
36. A ramp is being built next to a 4-inch-highsidewalk, as shown in the diagram below. Which trigonometric relationship could be used to find the value of x ? • Cos 10o = 4/x • Cos 10o = x/4 • Tan 10o = 4/x • Tan 10o = x/4 index
37. The number of hamburgers sold at a local restaurant varies inversely with the price that is charged. The number, n, of hamburgers sold at a price, p, in dollars can be found using theformula n = 687.5/p. Approximately how many hamburgers did the restaurant sell if the price of the hamburgers was $3? A. 278 B. 229 C. 225 D. 215 index
38. The areas in square miles of the Great Lakes are shown in the bar graph. Based on this graph, which set of numbers is the closest to the total area of the five Great Lakes? A. between 70,000 and 80,000 square miles B. between 80,000 and 90,000 square miles C. between 90,000 and 100,000 square miles D. between 100,000 and 110,000 square miles index
39. Points R and T are the midpoints of the sides oftriangle QSU, as shown in the diagram below.What is the perimeter of ΔRST? A. 26 B. 40 C. 54 D. 80 index
40. The vertices of a kite are located at the pointsP (–2, –1), Q (–1, –2), R (–2, –5), and S (–3, –2).The image of the kite is reflected over the x-axis, and then the reflected image istranslated 3 units to the right and 2 units up. Provide the coordinates for the vertices of the final image of the kite. Provide a graph, calculations or reasoning to explain how you determined the coordinates. (2 points) Write the answer on separate paper. Scoring Guidelines index
41. What is the value of the expressionn2 – w2/q if n = 1/3 , w = -6 and q = 2/3? • -53 8/9 • -23 8/9 • 24 1/9 • 54 1/9 index
42. Population data for Ohio is provided in the table below. A. 0.4910 B. 0.0170 C. 0.0147 D. 0.0070 Based on the data, what is the probability, rounded to the nearest ten thousandth, that a male selected at random in Ohio in 1998 would have been Hispanic? index
43. A company is comparing two different postage plans for next year. The company can purchase a postage plan where the total cost, c1, is $45,000 plus $3,000 per mailing, where n is the number of mailings. The cost, c2, of the other plan is $0.35 for each piece, p, mailed. Which of the following is a set of equations modeling the costs of the two plans? A. c1 = 45000n + 3000 c2 = 0.035p B. c1 = 45000 + 3000n c2 = 0.35 + p C. c1 = 45000n + 3000 c2 = 0.35 + p D. c1 = 45000 + 3000n c2 = 0.35p index
44. The Johnsons were going to a family weddingand drove a total of 1,244 miles to reach theircousin’s house. They spent 9 hours driving thefirst day at an average speed of 60 miles perhour. They reached their cousin’s house on thesecond day after driving 11 hours. What was their average speed on the second day? A. 60 miles per hour B. 62 miles per hour C. 64 miles per hour D. 78 miles per hour index
Question 5 – Scoring Guidelines index Q. 5 Scoring Continued
Question 17 – Scoring Guidelines index Q. 17 Scoring Continued
Question 34 – Scoring Guidelines index Q. 34 Scoring Continued
Question 34 – Scoring Continued index Q. 34 Scoring Continued