Healthy Living & Weight Loss: Solutions & Trends in USA
380 likes | 466 Vues
Learn about the impact of obesity, strategies for weight loss, and trends in the USA. Explore medical problems, anthropometrics, treatment options, and mental toughness for effective healthy living. Understand the epidemic of obesity and its associated chronic diseases. Discover the importance of motivation and support in achieving your weight loss goals.

Healthy Living & Weight Loss: Solutions & Trends in USA
E N D
Presentation Transcript
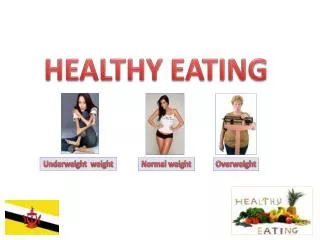
HEALTHY EATING And LIVING Kenneth E. Nixon MD
Problem Overweight and Obesity • 97 million adults are overweight or obese • Medical Problems Associated with O and O • Hypertension, high cholesterol, heart disease • Stroke, Arthritis, Sleep Apnea, Cancers • Increase in all cause mortality
ANTHROPOMETRICS • Height • Weight • BMI • Waist Circumference
Definitions • Overweight – BMI of 25 to 29.9 • Obesity – BMI of > 30 • 55% increase in last decade • Higher rates of O and O in • Minority groups • Lower incomes • Less education
Before Exercising…Ask the Doctor • Metabolic Syndrome • Hypertension • Diabetes • Obesity • Polycystic Ovary Syndrome • Anemia • Joint Pain • Evidence of heart disease
Treatment of O and O • Dietary treatment • Use of low-calorie diet and low fat diet • Altering physical activity • Behavior therapy techniques • Drugs • Surgery
Mental Toughness and Motivation • Examine why you are losing weight • What is your motivation? • Look at previous attempts at weight loss • Seek family, friends, work-site support • Examine time, attitudes, and capacity to increase physical activity Depression, Stress, Eating Disorders, Bulimia
OBESITY • $70 BILLON IN CHRONIC DISEASE • EPIDEMIC IN WEIGHT GAIN IN USA
Obesity Trends* Among U.S. AdultsBRFSS,1990, 1998, 2007 (*BMI 30, or about 30 lbs. overweight for 5’4” person) 1998 1990 2007 No Data <10% 10%–14% 15%–19% 20%–24% 25%–29% ≥30%
Obesity Trends* Among U.S. AdultsBRFSS, 1985 (*BMI ≥30, or ~ 30 lbs. overweight for 5’ 4” person) No Data <10% 10%–14%
Obesity Trends* Among U.S. AdultsBRFSS, 1986 (*BMI ≥30, or ~ 30 lbs. overweight for 5’ 4” person) No Data <10% 10%–14%
Obesity Trends* Among U.S. AdultsBRFSS, 1987 (*BMI ≥30, or ~ 30 lbs. overweight for 5’ 4” person) No Data <10% 10%–14%
Obesity Trends* Among U.S. AdultsBRFSS, 1988 (*BMI ≥30, or ~ 30 lbs. overweight for 5’ 4” person) No Data <10% 10%–14%
Obesity Trends* Among U.S. AdultsBRFSS, 1989 (*BMI ≥30, or ~ 30 lbs. overweight for 5’ 4” person) No Data <10% 10%–14%
Obesity Trends* Among U.S. AdultsBRFSS, 1990 (*BMI ≥30, or ~ 30 lbs. overweight for 5’ 4” person) No Data <10% 10%–14%
Obesity Trends* Among U.S. AdultsBRFSS, 1991 (*BMI ≥30, or ~ 30 lbs. overweight for 5’ 4” person) No Data <10% 10%–14% 15%–19%
Obesity Trends* Among U.S. AdultsBRFSS, 1992 (*BMI ≥30, or ~ 30 lbs. overweight for 5’ 4” person) No Data <10% 10%–14% 15%–19%
Obesity Trends* Among U.S. AdultsBRFSS, 1993 (*BMI ≥30, or ~ 30 lbs. overweight for 5’ 4” person) No Data <10% 10%–14% 15%–19%
Obesity Trends* Among U.S. AdultsBRFSS, 1994 (*BMI ≥30, or ~ 30 lbs. overweight for 5’ 4” person) No Data <10% 10%–14% 15%–19%
Obesity Trends* Among U.S. AdultsBRFSS, 1995 (*BMI ≥30, or ~ 30 lbs. overweight for 5’ 4” person) No Data <10% 10%–14% 15%–19%
Obesity Trends* Among U.S. AdultsBRFSS, 1996 (*BMI ≥30, or ~ 30 lbs. overweight for 5’ 4” person) No Data <10% 10%–14% 15%–19%
Obesity Trends* Among U.S. AdultsBRFSS, 1997 (*BMI ≥30, or ~ 30 lbs. overweight for 5’ 4” person) No Data <10% 10%–14% 15%–19% ≥20%
Obesity Trends* Among U.S. AdultsBRFSS, 1998 (*BMI ≥30, or ~ 30 lbs. overweight for 5’ 4” person) No Data <10% 10%–14% 15%–19% ≥20%
Obesity Trends* Among U.S. AdultsBRFSS, 1999 (*BMI ≥30, or ~ 30 lbs. overweight for 5’ 4” person) No Data <10% 10%–14% 15%–19% ≥20%
Obesity Trends* Among U.S. AdultsBRFSS, 2000 (*BMI ≥30, or ~ 30 lbs. overweight for 5’ 4” person) No Data <10% 10%–14% 15%–19% ≥20%
Obesity Trends* Among U.S. AdultsBRFSS, 2001 (*BMI ≥30, or ~ 30 lbs. overweight for 5’ 4” person) No Data <10% 10%–14% 15%–19% 20%–24% ≥25%
Obesity Trends* Among U.S. AdultsBRFSS, 2002 (*BMI ≥30, or ~ 30 lbs. overweight for 5’ 4” person) No Data <10% 10%–14% 15%–19% 20%–24% ≥25%
Obesity Trends* Among U.S. AdultsBRFSS, 2003 (*BMI ≥30, or ~ 30 lbs. overweight for 5’ 4” person) No Data <10% 10%–14% 15%–19% 20%–24% ≥25%
Obesity Trends* Among U.S. AdultsBRFSS, 2004 (*BMI ≥30, or ~ 30 lbs. overweight for 5’ 4” person) No Data <10% 10%–14% 15%–19% 20%–24% ≥25%
Obesity Trends* Among U.S. AdultsBRFSS, 2005 (*BMI ≥30, or ~ 30 lbs. overweight for 5’ 4” person) No Data <10% 10%–14% 15%–19% 20%–24% 25%–29% ≥30%
Obesity Trends* Among U.S. AdultsBRFSS, 2006 (*BMI ≥30, or ~ 30 lbs. overweight for 5’ 4” person) No Data <10% 10%–14% 15%–19% 20%–24% 25%–29% ≥30%
Obesity Trends* Among U.S. AdultsBRFSS, 2007 (*BMI ≥30, or ~ 30 lbs. overweight for 5’ 4” person) No Data <10% 10%–14% 15%–19% 20%–24% 25%–29% ≥30%
Goal of Weight Loss • 10 percent of baseline body weight in 6 months • BMI between 27 to 35, 300 to 500 kcal/day • This will result in .5 to 1 lb/wk and 10% loss in 6 months • BMI > 35 need a caloric deficit of 500 to 1000 kcal/day for 10% loss in 6 months
Weight Maintenance • Need continued dietary discretion • Continued physical activity • Continued behavior modification and motivation
Components of Daily Energy Expenditure Energy expenditure of physical activity Resting energy expenditure Thermic effect of feeding 8% 17% 8% 32% 75% 60% Sedentary Person (1800 kcal/d) Physically Active Person (2200 kcal/d) Segal KR et al. Am J Clin Nutr. 1984;40:995-1000. Slide Source: www.obesityonline.org
Joint Association of Walking and Vigorous Exercise with the Age-Adjusted Relative Risk of Cardiovascular Disease Manson, J. et al. N Engl J Med 2002;347:716-725
Multivariate Relative Risk of Cardiovascular Disease and Relative Risk Adjusted for Age and Walking Time, According to Walking Pace Manson, J. et al. N Engl J Med 2002;347:716-725
Conclusions • These prospective data indicate that both walking and vigorous exercise are associated with substantial reductions in the incidence of cardiovascular events among postmenopausal women, irrespective of race or ethnic group, age, and body-mass index • Prolonged sitting predicts increased cardiovascular risk