Download
1 / 32
320 likes | 452 Vues
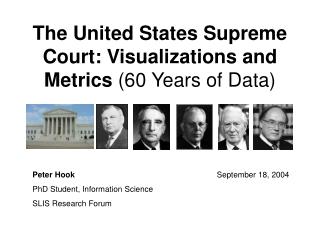
The United States Supreme Court: Visualizations and Metrics (60 Years of Data). Peter Hook September 18, 2004 PhD Student, Information Science SLIS Research Forum. Overall Goals. Gain insight into the work of the Supreme Court.

E N D
The United States Supreme Court: Visualizations and Metrics (60 Years of Data) Peter Hook September 18, 2004 PhD Student, Information Science SLIS Research Forum
Overall Goals • Gain insight into the work of the Supreme Court. • Implement visualization tools for legal scholars to evaluate the work of the Court. • Create visually rich teaching aids for legal instruction. (Concept Maps)
Origin of the Data • All Supreme Court Opinions with West Topic headings • 1944 term through the 2003 term • Harvested and cleaned by hand • From the Westlaw proprietary database
Data Elements • Case Name • Date of Issue • Chief Justice at Date of Issuance • Topics Assigned by West Publishing • Categories of topics (from West) • Sub-Categories of Topics (from West)
TEMPORAL INSIGHTS TIMESEARCHER SOFTWARE: Human Computer Interaction Laboratory at the University of Maryland. Hochheiser, H., Shneiderman, B. Visual Specification of Queries for Finding Patterns in Time-Series Data Proceedings Discovery Science 2001. Available at: http://www.cs.umd.edu/hcil/timesearcher/.
COMPARATIVE AREA INSIGHTS TREEMAP SOFTWARE: Human Computer Interaction Laboratory at the University of Maryland. Shneiderman, B. Tree visualization with treemaps: a 2-d space-filling approach, ACM Transactions on Graphics, vol. 11, 1 (Jan. 1992) 92-99.
West Category by Court (Normalized by Percentage of Overall Topics Issued by that Court)
INSIGHTS FROM NETWORK GRAPHING TECHNIQUES PAJEK SOFTWARE: University of Ljubljana, Slovenia. Batagelj, V., & Mrvar, A. Pajek: Program Package for Large Network Analysis, University of Ljubljana, Slovenia. 1997.
Co-Occurrence Objectives • To map the work of the Supreme Court based on the co-occurrence of West, top-level topics. • To evaluate whether the categories and sub-categories of West’s Outline of the Law suggest the manner in which topics co-occur in cases.
Degree of Connectivity • Total Nodes -- 289 • Range (Degree of Connectivity) – 1 to 250 • Mean (Degree of Connectivity) -- 26 • Median (Degree of Connectivity) -- 14 • Mode (Degree of Connectivity) -- 13 • Total Connections between Nodes - 3717
Node Color = West Category Node Size = Number of times topic appears in the dataset
PART A Chapter 16 Chapter 19 Chapter 14 Chapter 24 Chapter 3 Chapter 22 Chapter 2
Acknowledgments • Professor Katy Börner • Ketan Mane • Weimao Ke • Rongke Gao • Keith Buckley • Ralph Gaebler