Download
1 / 28
280 likes | 402 Vues
Explore the use of environmental gradient data in testing Earth system models at the CLIMMANI-INTERFACE Workshop. Discover examples of data sets and their applications in model comparisons. Learn about FLUXNET, EMDI, LIDET, and other key environmental data sets used in modeling Earth processes.

E N D
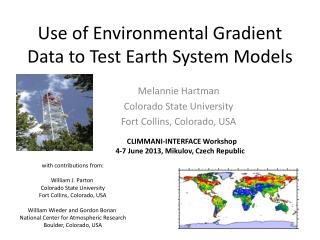
Use of Environmental Gradient Data to Test Earth System Models CLIMMANI-INTERFACE Workshop 4-7 June 2013, Mikulov, Czech Republic Melannie Hartman Colorado State University Fort Collins, Colorado, USA with contributions from: William J. Parton Colorado State University Fort Collins, Colorado, USA William Wieder and Gordon Bonan National Center for Atmospheric Research Boulder, Colorado, USA
OUTLINE • Environmental Gradient Data Sets • Examples of how these data sets have been used to test Earth System Models • may also involve model comparisons • Models Community Land Model version 4.0 (CLM4) biogeophysics, hydrologic cycle, biogeochemistry, vegetation. http://www.cesm.ucar.edu/models/clm/ Daily Century (DAYCENT) ecosystem-level plant dynamics, hydrology, biogeochemistry
Environmental Gradient Data Sets • FLUXNET* Global network of micrometeorological tower sites that use eddy covariance methods to measure the exchanges of carbon dioxide, water vapor, and energy between terrestrial ecosystems and the atmosphere. 500+ tower sites - 30 regional networks – 5 continents • Ecosystem Model-Data Intercomparison(EMDI) * NPP field measurements world-wide (Olson et al., 2001) • Long-term Intersite Decomposition Experiment Team (LIDET) 10-year, 28-site study of litter decomposition and N dynamics (Gholz et al., 2000; Parton et al., 2007; Harmon et al., 2009). • Harmonized World Soils Database (HWSD) global SOC, soil texture, and pH (FAO, 2012) *ORNL Distributed Active Archive Center http://daac.ornl.gov/
Environmental Gradient Data Sets (cont’d) • 1-km NPP and GPP derived from MODIS satellite observations • Zhao et al. 2005, 2006 • MODIS and EMDI 10x10 km NPP • gridded, global NPP data by plant part • wood, fine roots, coarse roots, and leaves • MODIS and EMDI annual plant N and P uptake • gridded, global data (10x10 km) • N and P Mineralization • gridded, global data (10x10 km) • EMDI Plant NPP • 5000 observations • 0.5° x 0.5° global map MODIS • Great Plains Grassland NPP • - 12,000 observations • - spatial map of NPP • Great Plains Grassland and cultivated SOIL C • - 1,000+ observations • - gridded spatial maps and regressions
FLUXNET TOWER SITES • ~500 eddy covariance tower sites - 30 regional networks – 5 continents • Global, spatially gridded GPP and latent heat flux are upscaled from the FLUXNET tower data
(Control ) (revised two‐stream radiative transfer) (RAD and revised leaf photosynthesis) Bonan et al. (2011) Journal of Geophysical Research: Improving canopy processes in the Community Land Model version 4 (CLM4) using global flux fields empirically inferred from FLUXNET data
FLUXNET: Latitudinal Zonal Means Bonan et al. (2011) Journal of Geophysical Research
EMDI: NPP Observations and Model Comparison 933 site-level measurements CLM Randerson et al. (2009) Global Change Biology
10-year, 28-site study of litter decomposition and N dynamics http://andrewsforest.oregonstate.edu/research/intersite/lidet.htm
Long-Term Intersite Decomposition Experiment (LIDET) • Observations • 10-year study of litter dynamics for a variety of litter types placed in different environments • 20 sites: 2 tundra, 2 boreal forest, 5 conifer forest, 3 deciduous forest, 3 tropical forest, 2 humid grassland, 3 arid grassland • 9 litter types (6 species of leaves, 3 species of root) that vary in chemistry • Litter bags sampled once a year for C and N • Model simulations • CLM4cn, DAYCENT • Follow a cohort of litter (100 g C m-2) deposited on October 1 • Specified climatic decomposition index (CDI) to account for temperature and moisture • Soil mineral nitrogen • % C mass remaining (decomposition rates) • Fraction of initial N (mineralization/immobilization) Bonan et al (2013) Global Change Biology
Leaf litter mass loss – conifer forest 5 sites & 6 leaf litter types Shown are the site x litter mean and ± 1 SD CLM underestimates carbon mass remaining (overestimates mass loss), especially during first several years. This is common to all sites. Bonan et al (2013) Global Change Biology
LIDET: Leaf litter mass loss – all sites Bonan et al (2013) Global Change Biology
LIDET: Litter Nitrogen dynamics Maple, 0.81 %N Observations are sampled once per year. Shown are data for maple leaf litter at all biomes except arid grassland. Model data are sampled similar to the observations. CLM4cn overestimates immobilization. Larger biases for leaf litter types with lower initial %N Bonan et al (2013) Global Change Biology
HWSD: Steady-State Analysis of Global Soil Carbon Pools Observed litterfall increases soil C compared with CLM4 litterfall CLM4 spinup, 502 PgC HWSD (0-100cm), 1259 PgC CLM4 analytical + obs. litter inputs, 746 PgC DayCent analytical + obs. litter inputs, 978 PgC Observationally derived litter inputs from Matthews, E. (1997) Wieder et al., in revision
HWSD: Latitudinal Zonal Mean of Soil Organic C density HWSD (0-100cm) 1259 PgC DayCent, 978 Pg C CLM4, 746 Pg C Wieder et al., in revision
Summary • These data are valuable tools to guide terrestrial biosphere model development and evaluation • Field Measurements, Upscaled global gridded products, or MODIS derived • NPP & GPP • latent heat flux • litter decomposition (%C remaining, fraction of initial N) • soil carbon stocks • N and P plant uptake • N and P mineralization
References • Bonan, G. B., M. D. Hartman, W. J. Parton, and W. R. Wieder. 2013. Evaluating litter decomposition in earth system models with long-term litterbag experiments: an example using the Community Land Model version 4 (CLM4). Global Change Biology 19:957-974. • Bonan, G. B., P. J. Lawrence, K. W. Oleson, S. Levis, M. Jung, M. Reichstein, D. M. Lawrence, and S. C. Swenson. 2011. Improving canopy processes in the Community Land Model version 4 (CLM4) using global flux fields empirically inferred from FLUXNET data. Journal of Geophysical Research-Biogeosciences 116. • FAO, IIASA, ISRIC, ISSCAS, and JRC (2012), Harmonized World Soil Database (version 1.2), edited by FAO, Rome, Italy and IIASA, Laxenburg, Austria. • Gholz, H. L., D. A. Wedin, S. M. Smitherman, M. E. Harmon, and W. J. Parton. 2000. Long-term dynamics of pine and hardwood litter in contrasting environments: toward a global model of decomposition. Global Change Biology 6:751-765. • Harmon, M. E., W. L. Silver, B. Fasth, H. Chen, I. C. Burke, W. J. Parton, S. C. Hart, W. S. Currie, and Lidet. 2009. Long-term patterns of mass loss during the decomposition of leaf and fine root litter: an intersite comparison. Global Change Biology 15:1320-1338. • Matthews, E. (1997), Global litter production, pools, and turnover times: Estimates from measurement data and regression models, J. Geophys. Res., 102(D15), 18771-18800. • Olson RJ, Scurlock JMO, Prince SD, Zheng DL, Johnson KR (2001) . NPP Multi-Biome: NPP and Driver Data for Ecosystem Model-Data Intercomparison. Available on- line [http://www.daac.ornl.gov] from the Oak Ridge National Laboratory Distributed Active Archive Center, Oak Ridge, Tennessee, USA. • Parton, W., W. L. Silver, I. C. Burke, L. Grassens, M. E. Harmon, W. S. Currie, J. Y. King, E. C. Adair, L. A. Brandt, S. C. Hart, and B. Fasth. 2007. Global-scale similarities in nitrogen release patterns during long-term decomposition. Science 315:361-364. • Randerson, J. T., F. M. Hoffman, P. E. Thornton, N. M. Mahowald, K. Lindsay, Y. H. Lee, C. D. Nevison, S. C. Doney, G. Bonan, R. Stockli, C. Covey, S. W. Running, and I. Y. Fung. 2009. Systematic assessment of terrestrial biogeochemistry in coupled climate-carbon models. Global Change Biology 15:2462-2484. • Wieder,, W.R., J. Boehnert,, and G.B. Bonan Evaluating soil biogeochemistry parameterizations in Earth system models with observations, Global Biogeochemical Cycles, in revision • Zhao M, Running SW, Nemani RR (2006) Sensitivity of Moderate Resolution Imaging Spectroradiometer (MODIS) terrestrial primary production to the accuracy of meteorological reanalyses. Journal of Geophysical Research – Biogeosciences, 111, G01002, doi: 10.1029/2004JG000004. • Zhao MS, Heinsch FA, Nemani RR, Running SW (2005) Improvements of the MODIS terrestrial gross and net primary production global data set. Remote Sensing of Environment, 95, 164–176. EVALUATING TERRESTRIAL BIOGEOCHEMISTRY MODE L S 2483 r 2009
Bonan et al. 2011: Improving canopy processes in the Community Land Model version 4 (CLM4) using global flux fields empirically inferred from FLUXNET data
Steady-state analysis Observed litterfall increases soil C compared with CLM4cn litterfall Base DAYCENT (0-20 cm) “Deep” DAYCENT (0-100 cm) CLM4cn has more soil carbon than DAYCENT, but “deep” DAYCENT (0-100 cm) accumulates the most carbon