Download
1 / 19
190 likes | 343 Vues
Models of Earth. Snow Day 2. Bring your completed orange in to the next class f or an edible grade!. How can you flatten the curved Earth? . 1. using a felt-tip pen (sharpie), make a rough sketch of the outlines of the continents on the surface of an orange.

E N D
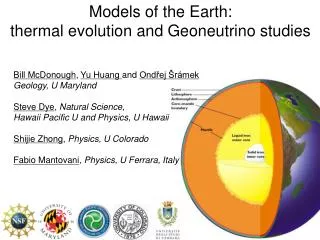
Models of Earth Snow Day 2
Bring your completed orange in to the next class for an edible grade! How can you flatten the curved Earth? • 1. using a felt-tip pen (sharpie), make a rough sketch of the outlines of the continents on the surface of an orange. • 2. using a plastic knife, or scissors, carefully peel the orange. If possible, keep the peel in one large piece so that the continents remain intact. • 3. try to lay the pieces of orange peel flat on a table. THINK IT OVER What happens to the continents when you try to flatten the pieces? What adjustments would you need to make to the shapes of the continents to get them to match their shape and position on a sphere?
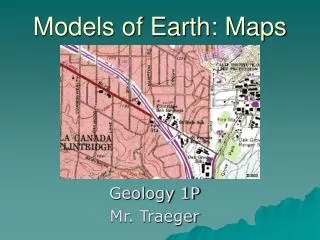
Getting started You want to invite relatives from out of town to a sports event at your school. You could use words to explain how to find the school: take the third exit off the highway, turn left at the first traffic light, and so on. But verbal directions can be hard to follow. Instead, you might sketch a map of the best route to your school. Maps use a picture instead of words to tell where things are.
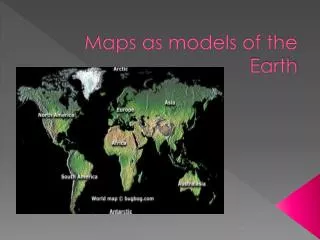
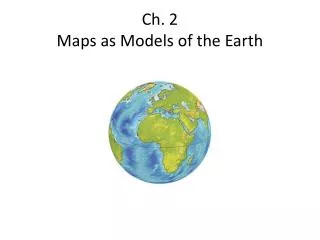
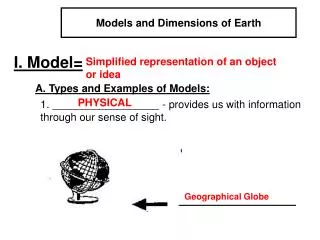
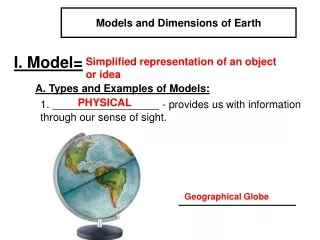
Maps and Globes map globe • Maps and globes show the shape, size, and position of Earth’s surface features. A map is a model on a flat surface of all or part of Earth’s surface as seen from above. A globe is a sphere that represents Earth’s entire surface. A glove correctly shows the relative size and shape of landmasses and bodies of water, much as if you viewing Earth from space.
maps and globes are drawn to scale and use symbols to represent topography and other features on Earth’s surface. • A map’s scale relates distance on a map to distance on Earth’s surface. • Scale is often given as a ratio. For example, one unit on the map equals 25,000 units on the ground. So one centimeter on the map represents 0.25 kilometers. This scale, “one to twenty-five thousand,” would be written “1:25,000.” Figure 7 shows three ways of giving a map’s scale.
Mapmakers use pictures called symbols to stand for features on Earth’s surface. A symbol can represent a physical feature, such as river, lake, mountains, or plain. A symbol also can stand for a human-made feature, such as a highway, a city, or an air port. A maps' key, or legend, is a list of all the symbols used on the map with an explanation of their meanings.
Maps also include a compass rose or north arrow. The compass rose helps the map user to relate directions one the map to directions on Earth’s surface. North usually is located at the top of the maps. Compass rose
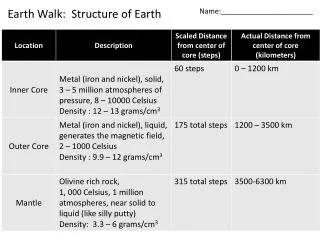
An Earth Reference System When you play chess or checkers, the grid of squares helps you to keep track of where each piece should be. To find a point on Earth’s surface, you need to reference system like the grid of squares on a checkerboard. Of course, Earth itself does not have grid lines, but most maps and globes show a grid. The grid is based on two imaginary lines: the equator and the prime meridian.
The Equator Halfway between the North and South poles, the equator forms an imaginary line that circles Earth. The equator divides Earth into the Northern and Southern hemisphere. A hemisphere is one half of the sphere that makes up Earth’s surface.
The Prime Meridian Another imaginary line, called the prime meridian, makes a half circle from the North Pole to the South Pole. The prime meridian passes through Greenwich, England. Places east of the prime meridian are in the Eastern Hemisphere. Places in the west of the Prime Meridian are in the Western Hemisphere.
Measurements on a Sphere To measure distances around a circle, scientist use units called degrees. A degree is 1/360 of the way around a full circle. If you started at the prime meridian and traveled west along the equator, you would travel through 360 degrees before returning to your starting point. If you started at the equator and traveled to one of the poles, you would travel 90 degrees-one quarter of the distance in a full circle.
Locating Points on Earth’s Surface Using the equator and prime meridian, mapmakers have constructed a grid made up of lines of latitude and longitude. You can use lines of latitude and longitude to find locations anywhere on Earth.
Latitude The equator is the starting line for measuring latitude, or distance in degrees north and south of the equator. Between the equator and both poles are evenly spaced lines called lines of latitude. All lines of latitude are parallel to the equator. Latitude is measured from the equator, which is 0 degrees. The latitude of each pole is 90 degrees north or 90 degrees south.
Longitude The distance in degrees east or west of the prime merdiian is called longitude. There are 360 lines of longitude that run from north to south, meeting at the plies. Each lime represents on degree of longitude. The prime meridian, which is strating line for measuring longitude, is at 0 degrees. Each longitude line crosses the latitude lines, including the equator, at a right angle.
Map Projections To show Earth’s curved surface on a flat map, mapmakers use map projections. A map projection is a framework of lines that helps to how landmasses on a flat surface.
Notice the distorted Size of Greenland Mercator Projection On a Mercator projection, the lines of latitude and longitude all appear as straight, parallel lines that form a rectangle. On a Mercator projection, the size and shape of landmasses near the equator are distorted only a little. But as you go toward the poles, size and shape become more and more distorted. The reason for this distortion is that lines of longitude do not come together as the poles as they do on a globe
Equal Area Projections • To solve the problem of distortion on Mercator projections, mapmakers developed equal area projection. An equal area projection correctly shows the relative sizes of Earth’s landmasses. But an equal area projection also has distortion. The shapes of landmasses near the edges of the map appear stretched and curved.
Review • What information does a map’s scale provide? • What do latitude and longitude each measure? • What are the advantages and disadvantages of an equa-area projection?