Download

1 / 46
470 likes | 633 Vues
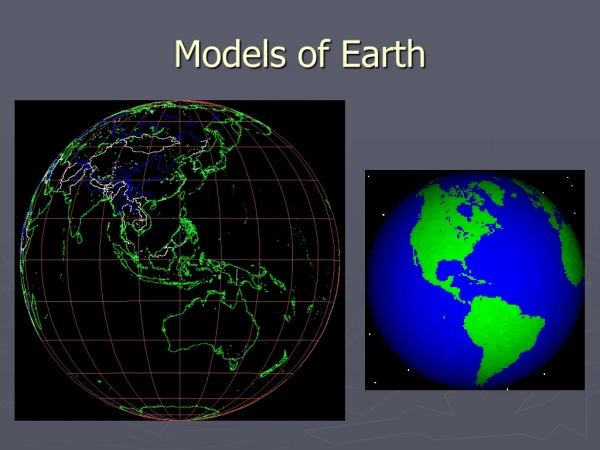
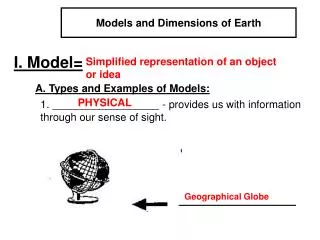
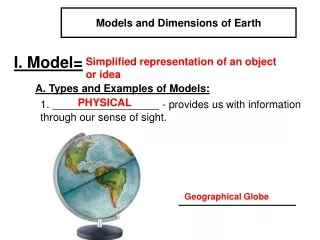
Models and Dimensions of Earth. I. Model =. Anything that represents the properties of an object. A. Types and Examples of Models:. _______. 1. Physical. -provides us with information through our sense of sight. globe.

E N D
Models and Dimensions of Earth I. Model = Anything that represents the properties of an object. A. Types and Examples of Models: _______ 1. Physical -provides us with information through our sense of sight. globe -a physical model with moving parts so that it can perform the functions or movements as the original object. 2. _______ Mechanical Model train 1
-mathematical relationships expressed by symbols, formulas and equation. _______ 3. Mathematical equations -a graph to provide a “picture” of a relationship of symbols, formulas and equations. 4. Graphic _______ Line graph Mental 5. _______ -models that can only exist in someone’s mind. Water molecule – H2O 1
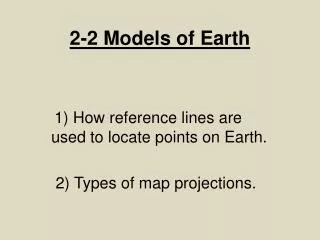
II. Shape of Earth A. Oblate Sphere - A flattened sphere 1. Flattened at poles 2. Bulges at Equator 3. Diagram of an _________________ Oblate sphere North Pole NOT TO SCALE Equator 4. Earth’s equatorial circumference is greater _______ than its polar circumference. South Pole a. Equatorial circumference - 24,900 miles b. Polar circumference - 24,860 miles 2
B. Causes of Earth’s Shape 1. Gravity _______ -an inward pulling force. This force pulls inward equally in all directions and causes earth to be spherical. __________ KEY: = force of gravity 2. Centrifugal Force _______ - An outward force caused by the spinning (or rotating) of earth on its axis. This force causes earth to bulge. _______ 3
a. The faster the rotational speed, the greater _______ the centrifugal force. b. (1) How long does it take each location to make one complete rotation? X 24 hours ________ X X Y Y • Y ________ 24 hours (2) Which location, X or Y, travels a greater distance to make one complete rotation? X _____ (3) At which location, X or Y, is the rotational speed greater? X _____ X _____ (4) At which location, X or Y, is centrifugal force greater? c. Therefore, the greater centrifugal force causes earth to bulge at the Equator. __________ 3
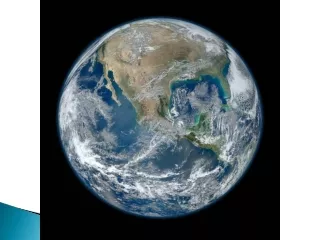
C. Evidence of Earth’s Shape 1. Photographs from space reveal that Earth is Almost a perfect sphere – very, very spherical – looks round to the human eye. 2. Observations of ships on the horizon The gradual “appearance” or “disappearance” of a ship over the horizon is evidence that earth’s surface is __________ curved. 3. Observations of an Eclipse of the Moon (as viewed from Earth) a. As viewed from space: As the moon orbits Earth, and travels from position 1 to position 2, it passes through Earth’s shadow. __________ 4
b. As viewed from Earth: c. Earth’s shadow on the moon (full moon) during a lunar eclipse provides evidence that Earth is ________ spherical. Top row shows a full moon gradually moving into Earth’s shadow (curved shadow). Middle row shows the moon entirely in Earth’s shadow. Bottom row shows the moon gradually moving out of Earth’s shadow (curved shadow). 5 Photos by Brian Ottum
4. Measurement of Gravity a. b. The shorter the distance between two objects, the greater the gravitational force. Therefore a person or object that is closer to the center of Earth (the center of gravity) would weigh more than when the person or object is farther from the center of gravity. c. (1) If Earth is an “oblate spheroid”, where on the surface of Earth would a person be closer to the center of the Earth? ________________ At the poles. (2) Where on the surface of Earth would a person weigh the most? _________________ At the poles. d. Under what circumstances would a person weigh the same everywhere on Earth? If Earth was a perfect sphere (perfectly round). _________________________________________________ 5
5. Observation of the North Star, Polaris a. The altitude of Polaris changes as an observer moves north or south (in the Northern Hemisphere); this is because Earth is _______ spherical and it’s surface is _______ curved. (Altitude is the height, measured in degrees that a heavenly body is above the horizon of the observer.) b. 90o 90o 60o 60o 35o 35o 0o 0o 6
c. North Pole Canada Southern U.S.A. Equator d. Summary: The altitude of Polaris (above the horizon) is equal to the latitude of the observer. 7
e. Locating the North Star To find Polaris: 1. Find the “Big Dipper” (Ursa major) 2. Find the two end stars in the bucket – these are the pointer stars. 3. Use your thumb and finger to measure the distance between the pointer stars. Polaris is 5 times that distance from the bucket of the Big Dipper. 7
IX. Parts of Earth A. The three “spheres” of outer Earth 1. the shell of gases that surrounds Earth. Atmosphere ____________ 2. the waters of Earth; its oceans, seas, lakes and rivers. ____________ Hydrosphere 3. the dense, solid outer shell of Earth composed of rock. ___________ Lithosphere 29 4. % of Earth’s surface is covered by land. ___________ atmosphere 5. Which sphere of Earth is: a. most dense? b. least dense? hydrosphere __________________ lithosphere lithosphere atmosphere __________________ 22
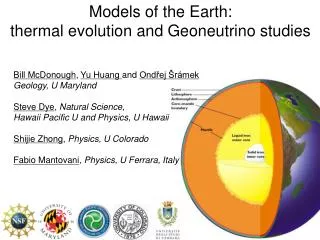
B. Earth’s Interior outer core crust mantle inner core 22
III. Size of Earth A. The Greek Mathematician, Eratosthenes, is credited as being the first man to make a scientific determination of Earth’s circumference. The time was about 200 BC – over 2000 years ago! 1. 2. Eratosthenes’ method for determining Earth’s circumference: part -------- whole 7.2o ------- 360o Angle 500 miles = ------------- Circum. Distance 7.2 x Circum. = 180,000 --------------- 7.2 ---------- 7.2 Circum. = 25,000 miles Actual Circum. = 24,881 miles 8
B. Earth’s other measurements Once Earth’s circumference is known, it’s other dimensions: diameter, radius, volume and surface area, can be calculated. 1. Calculating Earth’s diameter: C = π d 25,000 miles = 3.14 d D = 7961.7 miles ------------------ --------- 3.14 3.14 2. Based on Earth’s diameter, its radius would be: About 4000 miles. ___________ 3. Using the formula for the volume of a sphere, V = 4/3 π r3 Earth’s volume is: V = 4/3 x 3.14 x (4000)3 V = 1.3 x 3.14 x 64,000,000,000 V = 267,520,000,000 cubic miles. 4. Using the formula for area of a sphere, A = 4 π r2, Earth’s surface area is: A = 4 x 3.14 x (4000)2 A = 12.56 x 16,000,000 A = 200,960,000 square miles 9
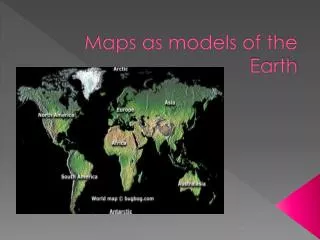
IV. Latitude and Longitude A. Latitude - Angular distance north or south of the Equator. 1. Parallels- Lines used for measuring latitude – they are “parallel” to the Equator and to each other. 2. Equator- 0o latitude, starting place for measuring latitude. 3. North/South Pole - 90o latitude, maximum latitude. Use a protractor to measure every 10o above the Equator. Draw parallel lines at each of these angles. RT p.3 RT p.4 RT p.5 10
B. Longitude - Angular distance east or west of the Prime Meridian 1. Meridians - Lines used for measuring longitude, they meet at the poles. 2. Prime Meridian - 0o longitude, starting place for measuring longitude. 3. International Date Line - 180o longitude, maximum longitude. Measure every 15o from the top. RT p. 3 RT p. 4 RT p.5 11
C. Determining Latitude and Longitude (Continents and Oceans) 1. Use the map to determine the latitude and longitude of these numbered and lettered locations. Name the continents and oceans indicated by the letters. 30o N 120o W 45o S 180o 45o S 75o E 40o-45o N 75o-80o W 0o 135o W 65o-70o N 0o 45o N 135o E 15o S 15o E 65o-70o S 165o W 20o-25o S 45o-49o W 12
C. Determining Latitude and Longitude (Continents and Oceans) 1. Use the map to determine the latitude and longitude of these numbered and lettered locations. Name the continents and oceans indicated by the letters. North America South America Atlantic Europe Pacific Asia Indian Africa Antarctic Australia Arctic Antarctica 12
D. Earth’s Time Zones 1. As Earth rotates on its axis, half of earth is facing the sun and is experiencing daylight; the other half is in darkness and is experiencing night. 2. When the sun is directly over a certain meridian, it is 12 noon at any location at or near that meridian. Sunrise Noon Midnight Sunset 3. Think: Earth is a sphere/degrees in a circle Earth’s -------------------------------------------------- = -------- = = Rotational Time/ Hours to make one rotation Speed 360o 15o/hr 24 hr 4. a. Number of time zones on Earth = b. Approximate width of each time zone = 24 ____ 15o _____ 13
5. a. If it is Wednesday, and you cross the International Date Line going west, it would then be _________ Thursday b. It is Tuesday, and you cross the International Date Line while traveling east, it would then be _________ Monday Going east subtract a day, going west add a day. 6. a. How many time zones are there in the continental U.S.? ____ 4 b. Is it earlier or later in California than in New York? _______ earlier c. If it is 8:00 EST, what time is it in PST? ______ 5:00 d. If is 6:00 MST, what time is it in EST? _____ 8:00 13
V. Fields- A region of space/area that has a measurable value of a given property at every point. A. Isolines - Lines on a field map connecting all points of the same value. B. The diagram below shows an elevation field map of a geographical region; the elevation is in feet (above sea level). Complete this field map by drawing isolines for 40, 50, 60, 70 and 80 feet. 1. What is the approximate elevation of point A B C 71 – 79 ft ~75 ft _______ 41 – 49 ft ~44 ft _______ _______ 51 – 59 ft ~56 ft 14 2. Isolines that show elevation are called contour lines. ______________
C. The field map below shows weather data plotted for a January morning. 1. What measurable property is shown on this map? ___________ temperature 2. Based on this property, the isolines on this map are called __________ isotherms 3. What is the approximate measurement for this property for New York State? ____ 5o C D. The field map below shows the average yearly number of thunderstorms in the United States. 1. Approximately how many thunderstorms occur each year in: a. Albany, New York – b. Los Angeles, California – New Orleans, Louisiana - 20 - 30 ________ Less than 10 ________ More than 70 ________ 15
VI. Topographic Maps . . .are maps of an elevation field A. Topographic Maps show elevation of the land by using contour lines, and show other natural and man-made features using symbols. B. Contour line - isolines on a map connecting points of the same elevation Elevation - Height above sea level (feet, meters, etc.) C. Contour interval - DIFFERENCE IN ELEVATION between two consecutive contour lines. D. Index Contour Line - Heavy, dark contour line, usually with numerical value for elevation marked. E. Depression Contour Line – Special contour lines used to show a hole or a crater on Earth’s surface. These lines are drawn like contour lines but are marked on the inside. F. Bench Mark (B.M.) - Marker in the ground indicating the “exact” elevation above sea level. G. Spot Elevations – are the elevations of such places as road intersections, hilltops, lake surfaces and other points of special interest. These points are located on the map by a small cross (+), unless the location is obvious, such as certain road intersections or hilltops. 16
Index contour Bench Mark Spot Elevation Can you find the following on this example of a topographic map? -Index contour -Bench mark -Spot elevation
Another example. Find the 1650 ft line. Find the 1700 ft line How many “steps up” are there between the 1650 and 1700 ft lines? 5 _____ How do you get from 1650 to 1700 in five equal steps? Go up by ten each time _______________ Therefore the contour interval on this map is 10 feet. ____________
Sometimes there will be more than one line with the same value on a map. This happens whenever there is a ridge or a valley. Notice that some of the lines here are different – they are called hachured lines. _______ The outside hachured line is always equal to the lowest contour line next to it. Going in from there the elevation goes down.
H. A simple contour map (or topographic map) Can you identify features 1, 2, and 3? Contour line 4. Contour interval - ________ 20 feet 5. Highest possible elevation (of the hilltop) - 259 feet _________ 6. Which is the steepest side of the hill: north, south, east, or west? 6. Which is the steepest side of the hill: north, south, east, or west? Hachure (depression) line Index contour line 7. How do contour lines show a steeper slope? Lines are closer together. ____________________ 8. What three (3) basic features of a landform do contour lines show? a. b. c. ____________________ elevation Steepness (gradient) ____________________ 17 Shape of the land ____________________
I. River Valleys (the law of V’s) – contour lines bend upstream where they cross a river. This can be used to determine the direction in which a river is flowing. Can you tell which way the stream is flowing now? Can you tell which way this stream is flowing? The stream flows from right to left. J. Common Symbols on Topographic Map swamp 1. 2. 3. 4. house, building 5. 6. 7. 8. railroad barn/garage church cemetery school Gravel pit, quarry, mine 17
Directions on a map Complete the statements below to give the correct direction between the cities on the map of Great Britain. Use the terms: north, northeast, east, southeast, south, southwest, west or northwest. VII. Map Reading Skills 1. Dublin is of Manchester. west ___ 2. Manchester is of Dublin. ____ east 3. Southampton is of Dublin. southeast _____ 4. Belfast is of London. northwest _____ 5. Glasgow is of Cardiff. ____ north 6. Limerick is of Aberdeen. ______ southwest 7. Aberdeen is of Limerick. ______ northeast 8. Manchester is of Newcastle. south _____ 19
B. Distance on a map. Use the given scale of miles on the map to determine the distance between the cities listed below. • Cardiff to Oxford = miles • Manchester to Dublin = miles • Oxford to London = miles • Plymouth to Limerick = miles • London to Manchester = miles • Aberdeen to Southampton = • miles • 7. Which is the greater distance, • a. from Aberdeen to Belfast • or 95 - 105 _______ _______ 180 - 195 _______ 55 - 70 _______ 230 - 245 150 - 165 _______ _______ 400 - 420 b. from Dublin to Oxford 19 b. from Dublin to Oxford
VIII. Topographic Map Skills A. Drawing Contour Lines on a Field Map - draw contour lines for 20, 40, 60, 80, 100, 120 feet. 20
B. Drawing a Profile from a Contour Map Step 1: Place the straight edge of a sheet of paper between the two points. 110 100 80 60 60 40 40 Step 2: Place a mark on the paper at each point where a contour line goes under the paper. (and at A and B) 80 120 100 123 Step 3: Write the elevation of each contour line next to each mark. 20
B. Drawing a Profile from a Contour Map Step 4: Lay the piece of paper under the grid. (Line up points A and B) 140 120 100 80 60 40 20 0 • • • • • • • Step 5: Place a dot on the grid at the correct elevation above each mark on the paper – keep the spacing the same. • • • • A B 40 110 40 100 80 80 120 60 123 100 60 Step 6: Draw a smooth line between the points. Make sure it dips below the bottom two points. Never draw the line straight across. Notice how the hill is steeper where the lines (and dots) are closer together. 20
C. Gradient - Rate at which elevation changes from place to place. Reference Table page = change in field value Gradient = --------------------------------- distance 1. Formula: 1 _______ 2. Calculating Gradient - Use the elevation field map that you drew contour lines on (which is one the previous page) to calculate the gradient between: a. Point A and point C 110 – 20 ft Gradient = ---------------- 3.5 miles 90 ft G = --------- 3.5 mi Elevation at A = 110 ft Elevation at C = 20 ft G = 25.7 ft/mi (Don’t forget units – use the equation to figure them out.) b. Point B and point D 123 – 13 ft Gradient = ---------------- 3 miles 110 ft G = --------- 3 mi Elevation at B = 123 ft Elevation at D = 13 ft G = 36.7 ft/mi (Don’t forget units – use the equation to figure them out.) 21
2. Calculating Gradient - Use the elevation field map that you drew contour lines on (which is one the previous page) to calculate the gradient between: c. Point B and point E 123 – 80 ft Gradient = ---------------- 1.5 miles 43 ft G = --------- 1.5 mi Elevation at B = 123 ft Elevation at E = 80 ft G = 28.7 ft/mi (Don’t forget units – use the equation to figure them out.) d. Point F and point C 27 – 20 ft Gradient = ---------------- 1.5 miles 7 ft G = --------- 1.5 mi Elevation at F = 27 ft Elevation at C = 20 ft G = 4.7 ft/mi (Don’t forget units – use the equation to figure them out.) 21
Determining the gradient on a field map Gradient Formula: Change in field value Gradient = Distance To determine the change in field value look at the value of the isolines To figure the change of value: 1. Determine the contour interval 2. Figure the amount of contour intervals 3. Multiply both figures • For the blue line • The contour interval is 20 • There are 6 contour intervals • The change in field value is 120 meters The change in field value of the orange line is 60 meters
To determine the distance use the map scale The blue line has a value of about 1.1 miles The orange line has a value of about 1.2 miles 120 = 109.1 meters/mile Gradient of the blue line is 1.1 60 = 50 meters/mile Gradient of the orange line is 1.2
The closer the isolines are the steeper the gradient The orange line has a lower gradient then the blue line. The steepest gradient of the map since the lines are closest together