Download
1 / 1
10 likes | 180 Vues
Performance comparison and system modeling of a Compton medical imaging system and a collimated Anger camera. Li HAN and Neal H. Clinthorne University of Michigan, Ann Arbor, MI, USA. B. Anger Camera with HEGP. I. Motivation

E N D
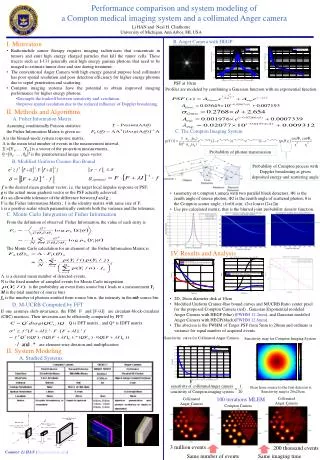
Performance comparison and system modeling of a Compton medical imaging system and a collimated Anger camera Li HAN and Neal H. Clinthorne University of Michigan, Ann Arbor, MI, USA B. Anger Camera with HEGP • I. Motivation • Radionuclide cancer therapy requires imaging radiotracers that concentrate in tumors and emit high energy charged particles that kill the tumor cells. These tracers such as I-131 generally emit high energy gamma photons that need to be imaged to estimate tumor dose and size during treatment. • The conventional Anger Camera with high energy general purpose lead collimator has poor spatial resolution and poor detection efficiency for higher energy photons due to septal penetration and scattering. • Compton imaging systems have the potential to obtain improved imaging performance for higher energy photons. • Decouple the tradeoff between sensitivity and resolution. • Improve spatial resolution due to the reduced influence of Doppler broadening. PSF at 10cm Profiles are modeled by combining a Gaussian function with an exponential function. II. Methods and Algorithms A. Fisher Information Matrix Assuming conditionally Poisson statistics C. The Compton Imaging System the Fisher Information Matrix is given as: A is the binned-mode system response matrix, Λ is the mean total number of events in the measurement interval, Y =[Y1, … ,YD] is a vector of the projection measurements, θ =[θ1, … , θP]Tis the parameterized image space vector Probability of photon transmission B. Modified Uniform Cramer-Rao Bound Probability of Compton process with Doppler broadening at given deposited energy and scattering angle f is the desired mean gradient vector, i.e. the target local impulse response or PSF; g is the actual mean gradient vector or the PSF actually achieved; δ is an allowable tolerance of the difference between f and g ; F is the Fisher information Matrix; I is the identity matrix with same size of F; λ is a positive scalar which parametrically controls both the variance and the tolerance. • Geometry of Compton Camera with two parallel block detectors. Φ1 is the zenith angle of source photon; Φ2 is the zenith angle of scattered photon; θ is the Compton scatter angle; r1=r01+rin; r2=r1out+r12+r2in • Use pre-calculated matrix, that is the blurred joint probability density function. C. Monte Carlo Integration of Fisher Information From the definition of observed Fisher Information, the value of each entry is The Monte Carlo calculation for an element of the Fisher Information Matrix is Λ is a desired mean number of detected events, N is the fixed number of sampled events for Monte Carlo integration is the probability an event from source bin i leads to a measurement Yl M is the total number of source bins fn is the number of photons emitted from source bin n, the intensity in the nth source bin IV. Results and Analysis D. M-UCRB Computed by FFT If one assumes shift-invariance, the FIM F and [F+λI] are circulant-block-circulant (CBC) matrices. Their inversion can be efficiently computed by FFT Q is DFT matrix , and Q* is IDFT matrix • 2D, 26cm diameter disk at 10cm • Modified Uniform Cramer-Rao bound curves and MUCRB Ratio center pixel for the proposed Compton Camera (red) , Gaussian Exponential modeled Anger Camera with HEGP (blue) (FWHM 12.2mm), and Gaussian modeled Anger Camera with HEGP(black)(FWHM 12.6mm). • The abscissa is the FWHM of Target PSF from 5mm to 20mm and ordinate is variance for equal number of acquired events. are element-wise division and multiplication II. System Modeling A. Studied Systems Sensitivity curve for Collimated Anger Camera Sensitivity map for Compton Imaging System 100 iterations MLEM Collimated Anger Camera Collimated Anger Camera Compton Camera 10cm from source to the first detector is Sensitivity map is 20x20cm 3 million events 200 thousand events Contact: Li HAN (lhan@umich.edu) Same number of events Same imaging time