Download
1 / 52
520 likes | 797 Vues
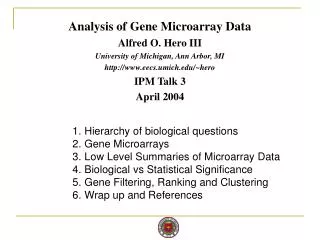
Analysis of Gene Microarray Data Alfred O. Hero III University of Michigan, Ann Arbor, MI http://www.eecs.umich.edu/~hero IPM Talk 3 April 2004. Hierarchy of biological questions Gene Microarrays Low Level Summaries of Microarray Data Biological vs Statistical Significance

E N D
Analysis of Gene Microarray Data Alfred O. Hero III University of Michigan, Ann Arbor, MI http://www.eecs.umich.edu/~hero IPM Talk 3 April 2004 • Hierarchy of biological questions • Gene Microarrays • Low Level Summaries of Microarray Data • Biological vs Statistical Significance • Gene Filtering, Ranking and Clustering • Wrap up and References
1. Hierarchy of biological questions • Gene sequencing: what is the sequence of base pairs in a DNA segment, gene, or genome? • Gene Mapping: what are positions (loci) of genes on a chromosome? • Gene expression profiling: what is pattern gene activation/inactivation over time, tissue, therapy, etc? • Genetic circuits: how do genes regulate (stimulate/inhibit) each other’s expression levels over time? • Genetic pathways: what sequence of gene interactions lead to a specific metabolic/structural (dys)function?
2. Gene Microarrays • Two principal gene microarray technologies: • Oligonucleotide arrays: (Affymetrix GeneChips) • Matched and mismatched oligonucleotide probe sequences photetched on a chip • Dye-labeled RNA from sample is hybridized to chip • Abundance of RNA bound to each probe is laser-scanned • cDNA spotted arrays: (Brown/Botstein) • Specific complementary DNA sequences arrayed on slide • Dye-labeled sample mRNA is hybridized to slide • Presence of bound mRNA-cDNA pairs is read out by laser scanner • 10,000-50,000 genes can be probed simultaneously
Oligonucleotide Chips Single feature on an Affymetrix GeneChip microarray Source: Affymetrix website
Oligonucleotide Chips Hybridization to sample Scanning and Readout Source: Affymetrix website
www.tmri.org/gene_exp_web/ oligoarray.htm Two PM/MM Probe sets Oligonucleotide GeneChip (Affymetrix) Probe set PM MM PM MM Fleury&etal:ICASSP (2001)
wt RNA ko RNA I-gene slides Gene Expression I-Gene Microarray ko/wt Experiment Source: J. Yu, UM BioMedEng Thesis (2004)
Treated sample (ko) labeled red (Cy5) • Control (wt) labeled green (Cy3)
Add Treatment Dimension: Expression Profiles Probe response profiles
Problem of Sample Variability Across-sample variability Across-treatment variability
Sources of Experimental Variability • Population – wide genetic diversity • Cell lines - poor sample preparation • Slide Manufacture – slide surface quality, dust deposition • Hybridization – sample concentration, wash conditions • Cross hybridization – similar but different genes bind to same probe • Image Formation – scanner saturation, lens aberrations, gain settings • Imaging and Extraction – misaligned spot grid, segmentation Microarray data is intrinsically statistical.
3. Low Level Summaries of Microarray Data GeneChip Spotted Array Raw Data Low Level Analysis Expression indices Medium Level Analysis High Level Analysis Source: Jean Yee Hwa Yang Statistical issues in design and analysis microarray experiment. (2003)
Knockout vs Wildtype Retina Study 12 knockout/wildtype mice in 3 groups of 4 subjects (24 GeneChips) Knockout Wildtype Hero,Fleury,Mears,Swaroop:JASP2003
4. Biological vs Statistical Significance: • Statistical significance refers to foldchange being different from zero • Biological significance refers to foldchange being sufficiently large to be biologically meaningful or testable, e.g. testable by RT-PCR Hero,Fleury,Mears,Swaroop:JASP2003
Biological and Statistical Significance:Minimum Foldchange Cube Hero,Fleury,Mears,Swaroop:JASP2003
5. Gene Filtering, Ranking and Clustering • Let fct(g) = foldchange of gene ‘g’ at time point ‘t’. • We wish to simultaneously test the TG sets of hypotheses: • d = minimum acceptable difference (MAD) • Two stage procedure: • Statistical Significance: Simultaneous Paired t-test • Biological Significance: Simultaneous Paired t confidence intervals for fc(g)’s Hero,Fleury,Mears,Swaroop:JASP2003
5.1 Single-Comparison: Paired t statistic • PT statistic with ‘m’ replicates of wt&ko: • Level a test: Reject H0(g,t) unless: • Level 1-a onfidence interval (CI) on fc: • p-th quantile of student-t with 2(m-1) df:
Stage 1: paired T test of level alpha=0.1 f(T(g)|H0) f(T(g)|H1) Area=0.1 T(g) 0 For single comparison: a false positive occurs with probability a=0.1
Stage 2: Confidence Intervals • Biologically&statistically significant differential response f(T(g)|H0) f(T(g)|H1) T(g) [ ] d 0 Conf. Interval on of level 1-alpha
Conf. Interval on of level 1-alpha Stage 2: Confidence Intervals • Biologically&statistically insignificant differential response f(T(g)|H0) f(T(g)|H1) T(g) [ ] d 0
Sorted FDRCI pvalues for ko/wt study a=50% a=20% a=10% Ref: Hero&etal:JASP03
FDRCI Results for ko/wt Data Ref: Hero&etal:JASP03
5.3 Gene Ranking • Objective: find the 250-300 genes having the most significant foldchanges wrt multiple criteria • Examples of increasing criteria: • Examples of mixed increasing and decreasing
Pareto Front Analysis (PFA) • Rarely does a linear order exist with respect to more than one ranking criterion, as in • However, a partial order is usually possible
x2 x2 Optimum x1 Illustration of two extreme cases • A linear ordering exists • No partial ordering exists
Non-dominated genes=Pareto Front Pareto Fronts=partial order Dominated gene Multicriteria Gene Ranking • Increasing • Decreasing A,B,D are Pareto optimal
Comparison to Criteria Aggregation • Assume (wolg): increasing criteria • Linear aggregation: define preference pattern • Order genes according to ranks of • Q: What are set of universally optimal genes that maximize for at least one preference pattern? • A: the non-dominated (Pareto optimal) genes
Ranking Based on End-to-End Foldchange (Yosida&etal:2002) • 16 human retinas • 8 young subjects • 8 old subjects • 8226 probesets Y/O Human Retina Aging Data Ref: Fleury&etal ICASSP-02
Multicriteria Y/O Gene Ranking • Paired t-test at level of significance alpha: • For Y/O Human study: Ref: Fleury&etal ICASSP-02
Multicriterion Scattergram:Paired t-test 8226 Y/O mean foldchanges plotted in multicriteria plane Ref: Fleury&etal ICASSP-02
Pareto fronts first second third Multicriterion scattergram: Pareto Fronts Buried gene Ref: Fleury&etal ICASSP-02
Monotonic? Ranking Based on Profile Shape Mouse Retina Aging Study • 24 Mouse retinas • 6 time samples • 4 replicates • 12422 probesets Ref: Hero&etal:VLSI03
Monotonic-Profile Ranking Criteria • Monotonicity: Jonckheere-Terpstra statistic • Large number of monotonic virtual profiles • Curvature: Second order difference statistic • Small deviation from linear • End-to-end foldchange: paired-T statistic • Large overall foldchange
Jonckheere-Terpstra Statistic # replicates=m=4 # time points=t=6 # profiles=4^6=4096 Ref: Hollander 2001
Multicriterion Scattergram: Aging Study Pairwise PFA Ref: Fleury&etalEurasip02
Accounting for Sampling Errors in PFA • Key Concepts: • Pareto Depth Distribution: Fleury&etal:ISBI04, Fleury&etal:JFI03 • Pareto Resistant Genes: Hero&Fleury:VLSI04 • Bayesian perspective: Pareto Depth Posterior Distn • Introduce priors into multicriterion scattergram • Compute posterior probability that gene lies on a Pareto front • Rank order genes by PDPD posterior probabilities • Frequentist perspective: Pareto Depth Sampling Distn • Generate subsamples of replicates by resampling • Compute relative frequency that subsamples of a gene remain on a Pareto front • Rank order genes by PDSD relative frequencies
Pareto Depth Posterior Distribution • Pareto front is set of non-dominated genes • Gene i is dominated if there exists another gene g such that for some q: • Posterior probability: gene g is on Pareto front • Can implement w/ non-informative prior on Hero&Fleury:VLSI03
Scattergram for Dilution Experiment Hero&Fleury:VLSI03
Pareto Depth Sampling Distribution • Let k be Pareto depth of gene g when leave out m-th replicate. Define • (Re)sampling distribution of Pareto depth Ref: Fleury and Hero:JFI03
PDSD Examples for 4 different genes Moderately Resistant Gene Stongly Resistant Gene Very Weakly Resistant Gene Weakly Resistant Gene Ref: Fleury and Hero:JFI03
False Discovery Rate Comparisons PT-ranking PDSD ranking PDSD ranking PT-ranking False Discovery Rate Correct Discovery Rate Ref: Fleury and Hero:JFI03
5.4 Unsupervised Clustering • Clustering Case Study: cDNA Microarray • Two treatments: Wildtype mice vs Nrl Knockout mice • 6 time points for each treatment • 4-5 replicates for each time point • Gene filtering via FDR produced 923 differentially expressed gene trajectories for cluster analysis Ref: JindanYu, PhD Thesis, BME Dept, Univ of Michigan, 2004.
Wt/ko Clustering Approach • Objective: To find clusters of wt/ko profile differences • Step 1: Encode each gene into a feature vector • Step 2: Cluster the rows of the 923x12 matrix • Three clustering techniques: • hierarchical, • k-means, • unsupervised clustering by learning mixtures X(g)=[wt0,wt2,wt6,wt10,wt21,ko0,ko2,ko6,ko10,ko21] X = [X’(1), …, X’(923)]’
Clustering via PML Learning of Mixtures • Hidden data model for class membership • Penalized maximum likelihood (PML) function • Maximization of PML via EM algorithm produces • An estimated number C of clusters • A “Soft”classification to class c of each gene g Ref: Figuieredo&Jain:PAMI2001
Cluster Visualization Selected by PML algorithm Result of PML mixture clustering of 800 genes (MDS projections onto 3D) JindanYu, Stat750 Project Report, Univof Michigan, 2004.
Clustered Trajectories: PML Mixture JindanYu, Stat750 Project Report, Univof Michigan, 2004.
Clustered Trajectories: k-Means JindanYu, Stat750 Project Report, Univof Michigan, 2004.
Compare to Hierarchical Clustering PML Mixture Clusters JindanYu, PhD Thesis, BME Dept, Univ of Michigan, 2004.