Download
1 / 32
320 likes | 445 Vues
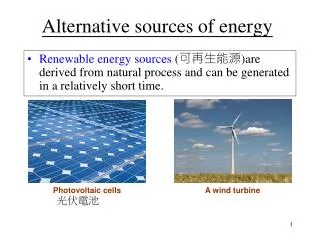
Overview of alternative energy sources. Some definitions: electric capacity vs. electric generation “proven reserves” vs. “resources” capacity factor Some numbers: global CO2 annual emissions (in Gigatonnes) US annual CO2 emissions price of electricity in Southeastern US

E N D
Overview of alternative energy sources • Some definitions: • electric capacity vs. electric generation • “proven reserves” vs. “resources” • capacity factor • Some numbers: • global CO2 annual emissions (in Gigatonnes) • US annual CO2 emissions • price of electricity in Southeastern US • average US household electricity use
Overview of alternative energy sources • Some definitions: • electric capacity vs. electric generation: the sum of all installed electricity-generating • infrastructure (what is available) vs. actual electric generation (what was actually used) • 2) “proven reserves” vs. “resources”: known, identified sources of energy vs. • projected based on distribution of geological features on Earth • 3) capacity factor: the ratio of actual energy delivered per unit time vs. the maximum • potential energy delivered per unit time • Some numbers: • global CO2 annual emissions (in Gigatonnes): 28 • US annual CO2 emissions: 5.7 • current price of electricity in Southeastern US: ~5 cents/kWhr • average US household electricity use: ~1000 kWhr/month
Power Units: The Terawatt Challenge 103 106 109 1012 1 W 1 kW 1 MW 1 GW 1 TW Power from Nate Lewis, Caltech
Global Energy Consumption, 2001 Gas Hydro Renew Total: 13.2 TW U.S.: 3.2 TW (96 Quads) from Nate Lewis, Caltech
Energy Reserves and Resources Rsv=Reserves Res=Resources Reserves/(1998 Consumption/yr) Resource Base/(1998 Consumption/yr) Oil 40-78 51-151 Gas 68-176 207-590 Coal 224 2160 from Nate Lewis, Caltech
Sources of C-free power1. Nuclear Energy2. Carbon Sequestration3. Renewables
US = 19% nuclear France = 80% Germany, Japan, Finland >25%
Nuclear (fission and fusion) • 10 TW = 10,000 new 1 GW reactors • i.e., a new reactor every other day for the next 50 years • 2.3 million tonnes proven reserves; 1 TW-hr requires 22 tonnes of U • Hence at 10 TW, terrestrial resource base provides 10 years of energy • More energy in CH4 than in 235U • Would need to mine U from seawater (700 x terrestrial resource base) • At $5/W, requires $50 Trillion (2006 GWP = $65 trillion) from Nate Lewis, Caltech
Carbon Sequestration from Nate Lewis, Caltech
CO2 Burial: Saline Reservoirs 130 Gt total U.S. sequestration potential US emissions ~6 Gt/yr • Near sources (power plants, refineries, coal fields) • Distribute only H2 or electricity • Must not leak • At 2 Gt/yr sequestration rate, surface of U.S. would rise 5 cm by 2100 DOE Vision & Goal: 1 Gt storage by 2025, 4 Gt by 2050 from Nate Lewis, Caltech