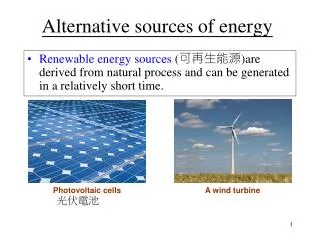
Download
1 / 16
160 likes | 278 Vues
This overview examines alternative energy sources and key concepts such as electric capacity versus generation, proven reserves versus resources, and capacity factors. It highlights crucial statistics, including global and US annual CO2 emissions, energy consumption rates, and the price of electricity. Furthermore, it outlines the current state and future requirements of energy production, emphasizing the significance of nuclear energy, carbon sequestration, and renewable sources in achieving sustainable energy solutions by 2050.

E N D
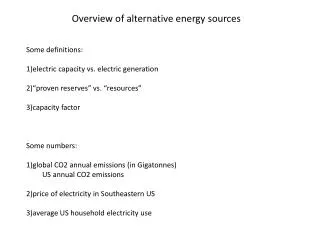
Overview of alternative energy sources • Some definitions: • electric capacity vs. electric generation • “proven reserves” vs. “resources” • capacity factor • Some numbers: • global CO2 annual emissions (in Gigatonnes) • US annual CO2 emissions • 2) global energy consumption (in TW) vs US • 3) price of electricity in Southeastern US • 4) average US household electricity use
Total 2006 = 13TW 4TW = transportation 2TW = electricity consumption (* but takes 5TW to make this!) BP Energy report, 2009
Overview of alternative energy sources • Some definitions: • electric capacity vs. electric generation: the sum of all installed electricity-generating • infrastructure (what is available) vs. actual electric generation (what was actually used) • 2) “proven reserves” vs. “resources”: known, identified sources of energy vs. • projected based on distribution of geological features on Earth • 3) capacity factor: the ratio of actual energy delivered per unit time vs. the maximum • potential energy delivered per unit time • Some numbers: • global CO2 annual emissions (in Gigatonnes): 28 • US annual CO2 emissions: 5.5 • 2) 13TW energy consumption (27% lost to inefficiency); US consumes 4TW • 3) current price of electricity in Southeastern US: ~9 cents/kWhr • 4) average US household electricity use: ~1000 kWhr/month
Power Units: The Terawatt Challenge 103 106 109 1012 1 W 1 kW 1 MW 1 GW 1 TW Power from Nate Lewis, Caltech
Global Energy Consumption, 2010 Total: 14 TW U.S.: 4 TW
Energy Reserves and Resources Reserves/(1998 Consumption/yr) Resource Base/(1998 Consumption/yr) Oil 40-78 51-151 Gas 68-176 207-590 Coal 224 2160 from Nate Lewis, Caltech
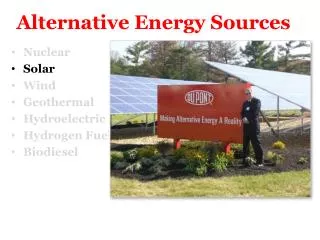
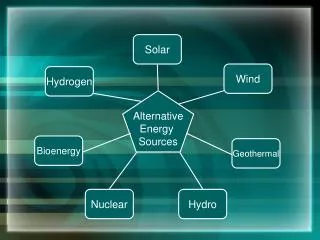
Sources of C-free power1. Nuclear Energy2. Carbon Sequestration3. Renewables
Sources of C-free power1. Nuclear Energy (19% in US, 90% in France)2. Carbon Sequestration (0% anywhere)3. Renewables (14% in US, 16% of global,and 81% in Iceland)
US = 19% nuclear France = 80% Germany, Japan, Finland >25%
@ consumption 68,000tU/yr, have ~80yrs
Nuclear (fission and fusion) • 10 TW = 10,000 new 1 GW reactors • i.e., a new reactor every other day for the next 50 years • 2.3 million tonnes proven reserves; 1 TW-hr requires 22 tonnes of U • Hence at 10 TW, terrestrial resource base provides 10 years of energy • More energy in CH4 than in 235U • Would need to mine U from seawater (700 x terrestrial resource base) • At $5/W, requires $50 Trillion (2006 GWP = $65 trillion) from Nate Lewis, Caltech
Carbon Sequestration from Nate Lewis, Caltech
CO2 Burial: Saline Reservoirs 130 Gt total U.S. sequestration potential US emissions ~6 Gt/yr • Near sources (power plants, refineries, coal fields) • Distribute only H2 or electricity • Must not leak • no at-scale • demonstrations DOE Vision & Goal: 1 Gt storage by 2025, 4 Gt by 2050 from Nate Lewis, Caltech