Download
1 / 36
360 likes | 532 Vues
NOAA Earth System Research Laboratory. Review of ensemble prediction fundamentals. Tom Hamill NOAA ESRL, Physical Sciences Division tom.hamill@noaa.gov. “Ensemble weather prediction”. possibly different models or models with “stochastic” elements so that if two initial conditions

E N D
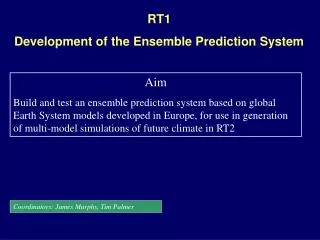
NOAA Earth System Research Laboratory Review of ensemble predictionfundamentals Tom Hamill NOAA ESRL, Physical Sciences Division tom.hamill@noaa.gov
“Ensemble weather prediction” possibly different models or models with “stochastic” elements so that if two initial conditions are the same, forecasts can still be different. Synthesize
Topics • Brief primer on chaos theory • Desired properties of ensembles • Initializing ensembles • Dealing with model error • mostly in Carolyn Reynolds’ talk • Ensembles & hurricanes • Some product ideas
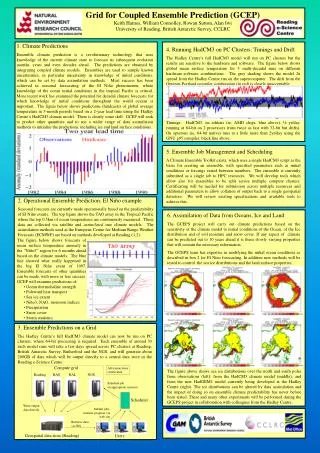
A toy dynamical system that has some characteristics of the weather The Lorenz (1963) model “Chaos” – why we use ensembles σ, ρ, βare fixed. Select initial conditions within range of analysis uncertainty. Result: errors grow more quickly for some initial conditions than others. Would be nice to quantify situational uncertainty. from Tim Palmer’s 2006 book chapter
Lothar 42-h MSLP forecasts deterministic forecast totally misses damaging storm over France; some ensemble members forecast it well. from Tim Palmer’s book chapter, 2006.
Question: what constitutes a “good” ensemble forecast? Here, the observed is outside of the range of the ensemble, which was sampled from the pdf shown. Is this a sign of a poor ensemble forecast? 7
Rank 1 of 21 Rank 14 of 21 Rank 5 of 21 Rank 3 of 21 8
Ensembles and truth should be draws from the same distribution We can only evaluate the quality of an ensemble when we have lots of samples from many situations to evaluate the characteristics of the ensemble. Happens when truth is indistinguishable from any other member of the ensemble. Happens when observed too commonly is lower than the ensemble members. Happens when there are either some low and some high biases, or when the ensemble doesn’t spread out enough. 9 ref: Hamill, MWR, March 2001
Such ensemble forecasts will be “reliable” (if there are enough members) In a reliable forecast, the event occurs at the same relative frequency as the probability you forecast. Note: even if the ensemble and the truth are drawn from the same distribution, with a small ensemble you won’t get reliable probabilities due to sampling error (Richardson, QJRMS, 2001) 10
“Sharpness” another desired characteristic of ensembles “Sharpness” measures the specificity of the probabilistic forecast. Given two reliable forecast systems, the one producing the sharper forecasts is preferable. But: don’t want sharp if not reliable. Implies unrealistic confidence. 11
“Spread-skill” relationships Small-spread ensemble forecasts should have less ensemble-mean error than large-spread forecasts.Demonstrate that ensembles can quantifying situational uncertainty. ensemble-mean error from a sample of this pdf on avg. should be low. ensemble-mean error should be moderate on avg. ensemble-mean error should be large on avg. 12
How we think about the process of generating an initial ensemble Observations Data Assimilation Forecast Model First Guess Analysis
How we think about the process of generating an initial ensemble observations have errors, and they aren’t available everywhere Observations Data Assimilation Forecast Model First Guess Analysis
How we think about the process of generating an initial ensemble observations have errors, and they aren’t available everywhere Observations Data Assimilation Forecast Model First Guess Analysis this will inevitably have some errors, else why assimilate new observations?
How we think about the process of generating an initial ensemble hence the “initial condition” will inevitably have some error; it will inherit some characteristics of the forecast error and theobservations. observations have errors, and they aren’t available everywhere Observations Data Assimilation Forecast Model First Guess Analysis this will inevitably have some errors, else why assimilate new observations?
How we think about the process of generating an initial ensemble hence the “initial condition” will inevitably have some error; it will inherit some characteristics of the forecast error and the observations. observations have errors, and they aren’t available everywhere Observations Data Assimilation Forecast Model First Guess Analysis and of course errors tend to grow with time, so it’d be helpful to have a sense of the diversity of possible outcomes this will inevitably have some errors, else why assimilate new observations?
EnKF (Ensemble Kalman Filter) naturally simulates uncertainty in observations, prior forecast (This schematic is a bit of an inappropriate simplification, for EnKF uses every member to estimate background- error covariances)
Ensembles provide estimates of forecast error & their correlation structure in the EnKF here, 20-member ensemble of short-term forecasts, showing uncertainty in the forecast position and structure of a hurricane vortex. Note, for example, more spread in MSLP in center of domain than on the edges.
An example of “analysis increment” from EnKF and 3D-Var This shows the adjustment to a wind observation 1 m/s greater to the background (at dot) in EnKF and in more classical “3D-Var” figure c/o Xuguang Wang, formerly CIRES/ESRL, now University of Oklahoma
Desirable properties for ensembles of initial conditions (1) true model state and ensemble are random draws from the same distribution (same as before). • i.e., ensemble samples “analysis uncertainty.” • implies larger differences between members in data voids, or where prior forecast differences were growing. (2) differences between subsequent forecasts ought to grow quickly enough that ensemble-spread consistent with ensemble mean error. • with perfect forecast model, (2) will happen naturally if you take care of (1)
Spread-error consistency Spread should grow as quickly as error; part of spread growth from manner in which initial conditions are generated, some due to the model (e.g., stochastic physics, higher resolution increases spread growth). Focus on initial-condition aspect.
from recently submitted Hamill et al. (2012) MWR manuscript For most models, spread of hurricane tracks is smaller than track ensemble-mean error.
Global ensemble forecast models have systematic under-estimation of maximum wind speed. Lesson: we’re far from conquering model error in NWP and ensembles.
“Model error” • Imperfections in the forecast model, due to: • inadequate resolution • unduly simple physical parameterizations • deterministic may be inappropriate • coding bugs • lack of coupling, e.g., ocean-atmosphere • use of limited-area nested model • boundary-condition imperfections • one-way nesting of outer domain, lack of ability for resolved scales to interact with planetary scales • etc.
Addressing model error(Carolyn Reynolds will review further) • Improve your model • Incorporate stochastic parameterizations where appropriate • Multi-parameterization • Multi-model • Post-processing using prior forecasts, obs • upcoming talk by Zoltan Toth
Ensemble products(what we’re here to discuss) • For the fields where we are starting to have some confidence in ensemble guidance, what can we do to convey that information in useful ways to the forecaster and to the public?
Example: Hurricane Bill Day 5 Day 4 Day 3 Day 2 Day 1 Initialized 00 UTC 19 August 2009. Contours provide fit of bivariate normal to ensemble data. Encloses 90% of the probability. All models slow, to varying extents. GEFS/EnKF, ECMWF, NCEP, FIM tracks decent. UKMO, CMC have westward bias.
An experimental multi-model product • Dot area is proportional to the weighting applied to that member • = ens. mean position • * = observed position Day 5 Day 4 Day 3 Day 2 Day 1 Day 0
Multi-model error (GEFS/EnKF, ECMWF, FIM, UKMO, CMC, NCEP) Not much improvement from multi-model (poorer models don’t seem to help much here)
Multi-model error (GEFS/EnKF, ECMWF only) Now some improvement, ~ 6 - 9 hours lead.
Questions • Mine: • Are ellipses, colors useful way of conveying ensemble information? • Are products like the multi-model synthesis shown here potentially useful to forecasters? • Should we only develop products just for hurricane aspects where we have some confidence (track), or also for those where we lack confidence (intensity)? • Yours
How the EnKF works: 2-D example Start with a random sample from bimodal distribution used in previous Bayesian data assimilation example. Contours reflect the Gaussian distribution fitted to ensemble data.