Download
1 / 46
460 likes | 477 Vues
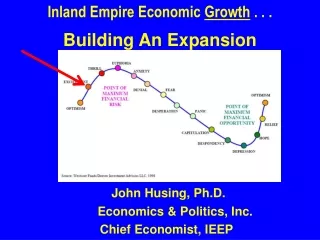
Dr. John Husing discusses the economic growth in the Inland Empire, focusing on job history, job gains/losses, industrial space absorption, manufacturing, and the impact on blue-collar sectors. Learn about the region's growth and potential challenges ahead.

E N D
Inland Empire Economic Growth . . . Building An Expansion John Husing, Ph.D. Economics & Politics, Inc. Chief Economist, IEEP
After Losing 8.71 Million Jobs …U.S. Jobs All The Way Back & More
Interest Rates Remain Benign Fed Likely To Make Two .0025 Move: September & December
U.S. & CA Unemployment History 6.4% 5.5% Great Recession
California Job Gains/Losses 2008-2010 -1,066,400 2011-2015e +1,942,492 2015 Up +879,733 Recovery Great Recession
Where is the IE in its Job History? 2008-2010 -142,933 Change +49,873 2011-2015 +192,807
Inland Empire Growth was the 2nd LargestAbsolute Job Gain in California in 2014!
How Regional Economies Work Secondary Tier Economic Development … Increase The Economic Base! Primary Tier
Strong Industrial Space Absorption 17,110,027 SF
Port Container Volumes -2.3% -15.0%
Nestle to close Valley food Plant 360 California jobs will be lost as Hot Pockets production goes to Kentucky BUSINESS Thursday, August 7, 2014 LATIMES.COM/BUSINESS :: “In higher skilled industries they are hesitant to move because the labor force is not available anywhere. But lower-skilled one, they have an easier time leaving. That trend in California has the potential to leave lower-educated workers behind.
Blue Collar Job Growth! Median Pay $43,911 Median Pay $51,923 Median Pay $49,391
Clash Reducing Poverty in a Marginally Educated Area Next Iteration in Clean Air
Causes of Public Health Difficulties • Socio-Economics 40% • Population’s Health Behaviors 30% • Access to Medical Care 20% • Environmental 10% 90% Source: Different Perspectives For Assigning Weights To Determinants of Health, University of Wisconsin, Public Health Institute, 2010
EPA-CARB-AQMD Standards Eliminating Ability of Blue Collar Sectors to Grow: • Manufacturing (Not Growing) • Logistics (Prime New Target) • Construction (NIMBY’s Love CEQA) • Blue Collar Sector Growth Needed To Allow Marginally Educated To Access the Middle Class • Poverty is Exacerbated as a Result!
HEI Releases Final Report CARB & EPA Appear To Be Ignoring Results of a Study They Helped Fund. AQMD Denies It Affects Their Positions …
Strategy • Congress & Legislature To Look Into Why EPA & CARB Have Basically Hidden The Health Effects Study • Look To Democrats In Low Income Districts To Work To Change Their Party’s Direction In CA Legislature • AB 1286
Office Absorption Follows Higher-End Workers & Residential Construction Activity High-End Jobs Follow Workers into the Area
Higher End Homes UPLAND $484,914 $465,778 Claremont $568,700 $427,095 $585,199 EASTVALE $468,269 $459,000 CORONA $429,667 TEMECULA $344,095 $393,603
Office Vacancy Rates Improving But Still High 24.0% 15.3%
High-End Job Growth Median Pay $55,308 Median Pay $65,904
Review • 2015 Better Than 2014 • Logistics Strong • Manufacturing Modest • Construction Returning • Health Care Set To Take-Off • Office Sectors Modest Return • Unemployment Down to 6.4% • Growth Strong • 49,800 Jobs Above Pre-Recession