**Financial Revenue Trends for 2011 - Analysis & Forecasts** Explore the probable revenue trends of 2011 affecting the 2
200 likes | 311 Vues
Discover the expected trends in revenue sources for the 2011 city budget, with projections for sales taxes, franchise fees, and more. Analyze the impact on the mill levy rate and understand the financial growth patterns for the upcoming year.

**Financial Revenue Trends for 2011 - Analysis & Forecasts** Explore the probable revenue trends of 2011 affecting the 2
E N D
Presentation Transcript
Probable Trends Valuation Growth – Will show slow growth again in 2011 affecting the 2012 mill levy rate. Sales Taxes – Since 2007, sales tax collections (from the City’s 1¢ sales tax) has hovered around $9.4 million. Franchise Fees – Citywide growth continues to annually add to this major revenue source. Trend : Edging Up 1.5% to 2.0% Trend : Edging Up 2.0% to 3.0% Trend : Strong 6.0% to 10.0%
Probable Trends Beginning Cash Balances – Although this revenue source does not have a “community growth” aspect, it remains a very important part of all budgeted funds. Trend : Flat (2.0%) to +2.0% depending on the budgeted fund Transfers– This revenue source also does not have a “community growth” aspect, but is very important to the General Fund and Bond & Interest Fund Trend : Flat (2.0%) to +2.0% depending on available revenues
Revenue Sources for the 2011 City Budget Including: Airport revenues, investment income, BID revenues, motor vehicle taxes, licenses and permits, sales and services, recreation fees, Sunset Zoo revenues, municipal court revenues, swimming pool fees, animal shelter revenues, CDBG revenues, delinquent taxes, etc. By individual category, each revenue source would be well less than 1% of the total City Budget. Collectively, they are a significant source of revenues for the annual City budget.
Beginning Cash Balances All budgeted funds Only 21% of the beginning cash balance in 2011 is related to property tax funds ($5,749,288). Of that percentage (21%), about 83% are beginning balances in the General Fund and Bond & Interest Fund.
Beginning Cash Balances All budgeted funds 72% of the difference between these two amounts ($8,738,167) is explained by: Enterprise Funds = $3,961,390 Economic Development Fund = $2,299,771
Changes in Cash Balances General Fund
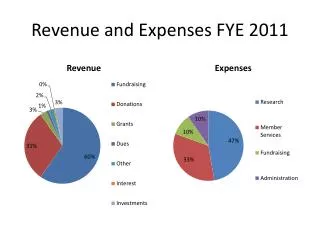
General Fund Revenues Actual General Fund Expenditures: $ 21,238,424
2012 General Fund Revenues Beginning Cash 5.5% Property Taxes 12.2% 86% of $ 23,916,541 Budgeted revenues forecasted Municipal Court Revenues 6.2% Sales Taxes 9.6% Transfers 32.6% Franchise Fees 19.0%
2012 Bond & Interest Fund Revenues Beginning Cash Property Taxes 11.6% 5.3% 8.7% Special Election Sales Tax 100% of $ 20,712,300 revenues forecasted. Special Assessments 8.5% STAR Bond Revenue 29.1% Sales Tax Transfer 18.0% TIF Bond Revenue 7.0% Other Revenues are less than 1%
Water Fund Rates 0 to 2 units 0 to 2 units 3 to 20 units 3 to 20 units 21 to 400 units 21 to 400 units 401 or more units 401 or more units
Waste Water Fund Rates 0 to 2 units 0 to 2 units Every unit over 2 Every unit over 2
Storm Water Fund Rates Only residential storm water rates are shown above
Questions, please? First Budget Work Session May 24th