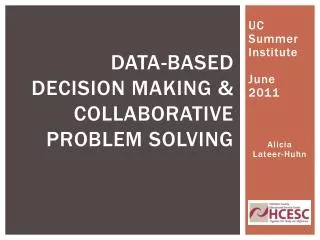
Data-Based decision making & collaborative problem solving
Data-Based decision making & collaborative problem solving. UC Summer Institute June 2011 Alicia Lateer-Huhn. Assessment. The BIG Picture. Progress Monitoring and Diagnostics. Academic Systems. Behavioral Systems. 1-5% Intensive Individualized Interventions.

Data-Based decision making & collaborative problem solving
E N D
Presentation Transcript
Data-Based decision making & collaborative problem solving UC Summer Institute June 2011 Alicia Lateer-Huhn
The BIG Picture Progress Monitoring and Diagnostics Academic Systems Behavioral Systems 1-5% Intensive Individualized Interventions 1-5% Intensive Individualized Interventions Progress Monitoring 5-10% Targeted Interventions 5-10% Targeted Interventions Universal Screening 80-90% School-Wide Interventions 80-90% School-Wide Interventions Adapted from OSEP Effective School-Wide Interventions Decisions about tiers of support are data-based
Assessment is used for different purposes: • Screening • Monitoring Progress • Instructional Planning (Diagnostic) • Program Evaluation / Outcomes
RtI Assessments • Tier 1: • Universal screening • Tier 2: • Progress Monitoring and additional information • Tier 3: • More frequent progress monitoring • More assessments based upon individualized needs (e.g. pre-requisite skills, diagnostics) *On-going assessments (e.g. formative, mastery, short-cycle, and informal assessments) are part of all 3 tiers and used in meaningful ways
What Question are we trying to answer within an RtI Framework?
Tier 1 Assessment • Universal Screening • Connected to key academic content or behavior • Conducted at least 3 times per year on a regular basis, using comparable test forms • Administered school wide to all students • Used to determine if additional examination is warranted • Features: short, few items, focus on critical indicators • 2 critical pieces of information • Is the Tier 1 core effective? • For all students (aggregated)? • For each subgroup of students (disaggregated)? • Who are the students needing additional support? What percent?
A Schoolwide Assessment System-Universal Screening • Criteria • Reliable and valid indicators of skills highly associated with academic success (reading and math) • Sensitive and accurate • Simple, quick, cost effective measures that are easily repeatable for continuous progress monitoring (practical) • Standardized • Reliability is critical. Need a process for training and integrity checks of data collection
Universal Screening Tools: • Reading • Dynamic Indicators of Basic Early Literacy Skills (DIBELS) • www.dibels.org or dibels.uoregon.edu • Curriculum Based Measurement (CBM; www.aimsweb.com or www.studentprogress.org) • Oral Reading Fluency • Maze • Math • Curriculum Based Measurement (e.g. www.aimsweb.com ) • Number sense • Computation fluency • Algebraic principles • Behavior • School Wide Information System (SWIS; www.swis.org)
Universal Screening: A Multiple Step Process at Secondary Level • How will we match students to appropriate supports (Why are they struggling?)? • Step 1: • All students at or below a team-selected percentile (e.g. 45th percentile) on state or district testing related to literacy Heartland AEA, IA
Multi-Gated System for Secondary 1st gate: • Assessment: Use of OAA/OGT (reading, social studies, science) and other available building screening data, such as CBM and common formative assessments to screen out students who are progressing well in Reading. May also consider Office Discipline Referral (ODR) data. • Support: • Pass = Daily Reading/English course focus on “big ideas.” All content-area teachers providing effective vocabulary and comprehension instruction • Doesn’t Pass = Go to Gate 2
Multi-Gated System for Secondary 2nd gate: • Assessment: Fluency assessment • Oral Reading Fluency – Probes available for 7th and 8th grade on www.aimsweb.com, create probes for 9th-12th on interventioncentral.org or use 8th-grade passages from Aimsweb • Support: • Pass = Needs additional instructional support in comprehension and/or vocabulary • Doesn’t Pass = Goes to Gate 3
Considerations for ORF Gate • Use Oral Reading Fluency data (i.e., words correct per minute) and accuracy information to determine if student “passes” • Purpose is to determine which students have adequate fluency. It’s important to know if students are: • accurate and fluent • inaccurate and fast • inaccurate and slow • accurate and slow • School team would need to set its own decision rules • Example: any student who scores below the 50% percentile on oral reading fluency and any student who is less than 97% accurate would go to Gate 3
Multi-Gated System for Secondary • 3rd gate: • Assessment: Phonics Assessment • Example: placement assessment from a research-based phonics intervention chosen for Tier 2 or advanced phonics assessment • Support: • Pass = Needs additional support in fluency • Access to supplemental Tier 1 fluency intervention (e.g. Read Naturally, Six Minute Solution) • Doesn’t Pass = Tier 1 plus Tier 2 support • Elective reading class where a research-based intervention is implemented. Program should focus on phonics in addition to fluency, vocabulary, and comprehension (e.g. use of Corrective Reading, REWARDS, Language!)
Before you make any data-based decisions… • How do you know the data are: • Accurate? • Valid? • Reliable? • Now, what question do the data answer?
Turn and Talk • Assessment inventory • Do you have tools that answer the question: • How healthy is your system? • Are students making progress/demonstrating mastery on targeted skills from Tier 1 core instruction? • Are you missing assessment tools?
Tier 2Progress Monitoring • All students receiving Tier 2 and 3 interventions are assessed on an on-going basis. • Quick assessments (1-5 minutes) • Administered frequently (weekly, bi-weekly) • Brief, parallel versions • Sensitive to changes in student performance • Individual student graphs with goal and aim-line
Progress Monitoring Progress monitoring is designed to: • Estimate rates of student improvement and skill development. • Identify students who are not demonstrating adequate progress. • Compare the efficacy of different forms of instruction and design more effective, individualized instructional programs for students struggling to progress.
Tier 3 Assessments • DIBELS/AIMSweb • Benchmarks • Mastery tests • Diagnostics • DRA • Placement tests • Checklists • Self-monitoring • CBM • Progress Monitoring-same characteristics as tier 2, but more frequent/intensive monitoring • Decision rules made with at least 7 data points • Diagnostic assessment to ensure accurate focus of intervention • Sample reading assessments
Tier 3 Additional Assessment:Diagnostics / Instructional Placement • For students who are struggling, further diagnostic assessment may be completed to gather more in-depth information: • specific skill deficits and • patterns of skills the student does or does not have to determine instructional placement • (May be used at Tier 2; always used at Tier 3)
Decision Rules for Moving Between Tiers • Must establish clear decision rules for data and intervention implementation. This is a fluid model!! Clear procedures are needed. • Moving from Tier 1 to Tier 2 • Moving from Tier 2 to Tier 1 • Moving from Tier 2 to Tier 3 • Moving from Tier 3 to Tier 2
Examples of Decision Rules for Moving Between Tiers Student Data • Have at least 7 data points in a phase • 3 Data-point decision rule—If 3 consecutive data-points are found below the aim line, suggests that you need to change the intervention. • 3 Data points above the goal line suggests need for a change: in goal, fade intervention support, move to more challenging material. Intervention Implementation Data • Intervention occurred at least 80% of the time (child and teacher present) • Integrity was checked every other month and was done with at least 85% adherence
Do We Really Collaborate?! OIP Facilitator’s Guide, September 2010
A Collaborative Team: A group of people working interdependently to achieve a common goal for which members are mutually accountable. DuFour, Eaker, & DuFour, 2007
Collaborative Problem Solving • Problem Definition: What is the problem (discrepancy between actual and expected performance? • Problem Analysis: Why is the problem occurring? • Goal Setting: What do we want to see happening by when? • Plan Development & Implementation: What will be done to meet the goal and how will progress be measured? • Plan Evaluation: Did we implement the plan as described and is it working?
RtI Planning Tools • Elementary and Secondary Versions • Purpose of the Planning Tool and supporting documents • Utilizes the Collaborative Problem Solving Process • Available electronically: www.sst13.org Response to Intervention
Moving Upstream:A Story of Prevention and Intervention MiBLSi
In a small town, a group of fishermen gathered down at the river. Not long after they got there, a child came floating down the rapids calling for help. One of the group on the shore quickly dived in and pulled the child out. MiBLSi
Minutes later another child came, then another, and then many more children were coming down the river. Soon everyone was diving in and dragging children to the shore, then jumping back in to save as many as they could. MiBLSi
In the midst of all this frenzy, one of the group was seen walking away. Her colleagues were irate. How could she leave when there were so many children to save? After long hours, to everyone’s relief, the flow of children stopped, and the group could finally catch their breath. At that moment, their colleague came back. They turned on her and angrily shouted: “HOW COULD YOU WALK OFF WHEN WE NEEDED EVERYONE HERE TO SAVE THE CHILDREN?” MiBLSi
She replied, It occurred to me that someone ought to go upstream and find out why so many kids were falling into the river. What I found is that the old wooden bridge had several planks missing, and when some children tried to jump over the gap, they couldn’t make it and fell through into the river. So I got someone to fix the bridge. MiBLSi