Download
1 / 61
620 likes | 962 Vues
Energy Efficient Motors and Transformers Workshop MOTORS LIEN 7 May 2003. Dr Hugh Falkner MIEE CEng Future Energy Solutions. Contents. The System Perspective Higher Efficiency Motors Motor Management Policy VSDs Identifying energy saving opportunities Maintenance and Energy Saving

E N D
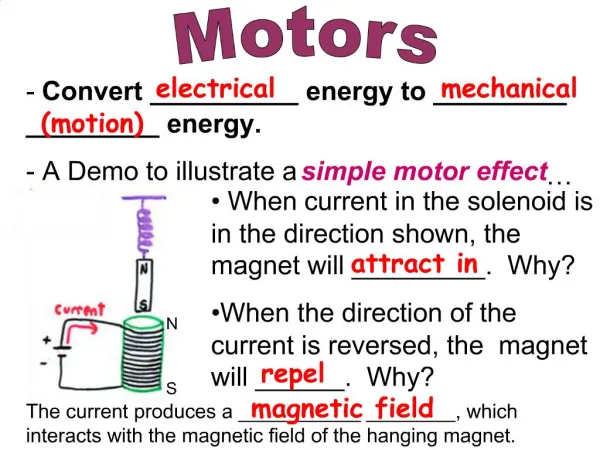
Energy Efficient Motors and Transformers WorkshopMOTORSLIEN 7 May 2003 Dr Hugh Falkner MIEE CEng Future Energy Solutions
Contents • The System Perspective • Higher Efficiency Motors • Motor Management Policy • VSDs • Identifying energy saving opportunities • Maintenance and Energy Saving • Condition Monitoring
Motors • Understand the system - its about much more than the motor • Focus you efforts where the best opportunities are • Don’t make an issue of it, make energy saving projects a matter of policy • Assess the non-energy saving benefits, the paybacks are better and you get more support • Look to integrate energy saving in to higher management concerns • Is it set up right - are you sure?
Before you look at the equipment….Ask some simple questions first • What is it trying to do? • Is it useful? • Is is still needed, or has the process changed? Don’t waste time making a useless system more efficient!
Which Systems Merit the Most Attention? Some likely candidates: • Problem systems • Production-critical systems • Large systems • Systems with high operating hours Keep in mind the 80/20 rule of thumb: • About 80% of the potential savings will come from about 20% of the systems
Key Points • Higher Efficiency Motors do cost a bit more, but they can give a payback in as little as 1 year • HEMs have other benefits which make them even more attractive • It is rarely cost effective to replace existing motors with new HEMs. • Over-sizing can waste some energy, but think carefully before fitting a smaller motor
The HEM saving Average savings of 3% don’t sound very impressive compared to VSDs. But, if all your motors were HEMs, the savings would be huge Remember: • You can use HEMs everywhere • You do not have to make complicated calculations • They cost much less than a VSD • They do not affect the performance of the equipment
Other benefits of HEMS • Better power factor • Better part load efficiency • Less noise • Less heat • Increase available site electricity for other equipment
The European efficiencylabeling scheme 4 pole 2 pole % Efficiency kW 1.1 90
The Effect of voltage variation on motor characteristics Characteristic Voltage Voltage 6% High6% Low
Motor Management Policy • The savings from using single Higher Efficiency Motors are small - but the savings from all the motors on a site quickly become something very significant. • Understand the costs of repairing failed motors • Have a Motor Repair/replace policy
ECONOMICS OFREPLACEMENT VS. REPAIR Depends on many factors... • Running hours • Load • Cost of electricity • Cost of new motor • Cost of motor repair
MOTOR REPAIR - THE PROBLEMS Typical faults from a sub-standard repair • Increase in core losses • Wrong winding specification • Badly fitted bearings • Incorrect fan • Poor rotor alignment
THE REAL COST OF REWINDING A MOTOR Original - 90.5% Repair - 90.0% HEM - 92.5% HEMsaving- $679
Policy on Motor Failure • Decide using Replace:Repair chart • If less than _kW - REPLACE anyway • If very damaged - REPLACE anyway • If an HEM - REPAIR • For over-riding operational reasonsthese instructions can be ignored, but explanatory form must be completed
Getting everybody involved is essential - everyone has different motivations
Motor Management Policy at North West Water • Get Senior Management on your side - and get everybody to “buy in” • Be prepared to overcome the obstacles in your way - and to see through changes in “the way things are done” • Consider shifting responsibility by Contracting out. • Pace yourself for a long slog - and try not to lose heart half way • The energy saving benefits alone make it very worthwhile
Is speed control right for you? Before deciding to alter the speed, make sure that you understand the system. Otherwise you could make things worse! If the machine can always turn at a lower speed, then you could alter the speed in many ways, you don’t have to use a VSD. However, as the price of VSDs gets lower, they are being used in more and more applications
Why do we want to control speed? • Being able to alter the speed of a fan, pump, conveyor, machine tool, gives us tremendous opportunities to better control the process. • In some applications, it can also save lots of energy. • There are lots of ways to control the speed of a machine, not just the VSD!
Altering the flow by using sequencers • In some circumstances it makes more sense to switch machines on/off to match the flow to the demand. • Common examples are pumps or air compressors
100 80 Input Power (%) 60 40 20 0 0 10 20 30 40 50 60 70 80 90 100 Speed (%) Fan Affinity Laws (Applies to all centrifugal loads) • Flow proportional to the speed • Pressure proportional to the speed squared • Power proportional to the speed cubed
Inherent VFD Benefits • Controls speed variations • Provides mechanical control • Eliminates startup impacts causing system vibration • Provides fault tolerance • Supports soft starts • Restarts spinning load • Controls speed swings • Enhances product quality • Conserves energy • Repeats results
Getting the Economics right • Look for applications where you can reduce the speed by at least 20% • Look for applications operating at least 4,000 hours pa • Watch out for applications with high static head
Important Considerations for Variable Speed Drives • Engineering analysis required for each unique application • Load profile of the driven equipment must be evaluated over the full range of operating conditions: • Effect of reduced speed on torque • Affinity laws apply for frictional pump systems, but not for static head-dominated systems
Methods of control AVSD is only as good as the way it is commissioned. There are two methods of control: • Open Loop. The speed is simply controlled by a potentiometer. The speed is set either by a person, or perhaps by simple controls allowing perhaps 2-4 speeds, depending on the situation. • Closed Loop. This is much more powerful, with the user setting the flow, temperature, pressure, or whatever else it is that they want to control. Using a sensor, the VSD adjusts the speed automatically to maintain this parameter. This will always give optimum results, as long as it is set up properly!
How good are your controls? • Was it properly commissioned? • How were the settings decided on? • How much “safety margin” have you got? • How quick does your system respond? • How good are your sensors? • Has anyone altered the settings? • Has it been switched to manual?
De-rating of Motors • Because the generated waveform is not a smooth sinusoid, there is additional heating within the motor. • In the past this has meant de-rating the motor by up to 10% • With more modern PWM VSDs working at higher switching frequencies, the waveforms are much cleaner, and so the de-rating is much less. • Some manufacturers claim that you don’t have to apply any de-rating at all - but always check first • In practice, with centrifugal loads, the power goes down so fast with speed, that just a small reduction in speed will compensate for the additional heating due to a poor waveform
Prescreening Motor Systems - getting at the VITAL FEW To categorize by motor size and run time, don't we need to do a plant-wide inventory? • Not only do we not need it, it would be the WRONG thing to do • The first level of screening - by size and run time - should be a one day effort for many plants • Plant operations involvement is essential
Where to look • At many sites the main production equipment is well maintained, and so there is not much opportunity for making changes. Also the costs of downtime might be too high! • Look instead at the backroom services. These are often neglected, running long hours and badly matched for current demand patterns. They also have big motors, and lots of opportunity for better controls such as VSDs or sequencers
SYMPTOMS: Looking & Listening Some symptoms of interest for pumping systems: • Systems with throttled flow control or bypass flow control • The presence of significant cavitation noise, either at the pump or elsewhere in the system • Frequent pump starting and stopping • Multiple operating parallel pumps (where the number of operating pumps seldom changes)
Secondary prescreening: • Required data include: • flow rate • head • electrical input power • Test gauges preferred over permanently installed gauges • Flow rate can estimated using pump curves
Secondary screening - the costs increase • This will take time and money, so think carefully what you need to know • Don’t collect more data than you need • Never collect data because “it may be useful one day” • The objective of data collection is to refine your estimate of the cost effectiveness of an energy saving measure so that you are confident that you should, or should not, do it. • And don’t forget to take measurements once the energy saving measure has been fitted. This way you can tell everybody how clever you are!
Estimating power without taking any electrical measurements • Measuring the speed of the motor with a stroboscope can give a useful indication of motor power - ideal for initial screening • Accuracy of perhaps +/- 20% • Very Quick!
The slip method of estimating motor power This is based on the fact that the torque:slip characteristics in the normal operating region of an induction motor are very straight. So, at full rated load the motor will be at its maximum slip (and hence minimum speed.) By comparing the actual measured speed with the nameplate rated slip, the power can be estimated. Mechanical Power = (nno load - n meas) x kW (rated) (nno load - nrated) Nrated Nmeas Torque nno load = No load (synchronous) speed n meas = Measured speed n rated = Nameplate rated speed Speed Nno load
Worked Example of estimating motor power from the speed From the nameplate, 1,470rpm at 55kW (rated) load Using the stroboscope it is measured at 1,480 rpm. What is the load?
Solution Load = 1,500 - 1,480 = 20 = 67% of rated power 1,500 - 1,470 30 Mechanical (output) power is 67% x 55kW = 37kW This is only approximate, but it does give a very quick indication of power consumption
Joint benefits of system improvements • Fitting a VSD not only saves energy, but also: • Reduced speed means less frictional wear, longer bearing and seal life. • It reduces water hammer and resulting damage. • Improved pressure control reduces leakage • Impeller coating reduces pump wear, saving energy and maintenance costs. You’ll struggle to save energy and not reduce maintenance costs, and vice versa.
Perspectives on a Site Energy Audit • The Energy Manager - Sees equipment as consumers of energy • The Salesperson - Keen to show the latest technology • The Production Manager - Reliability and performance of the plant • The Maintenance Engineer - The costs of maintaining plant and related on-going problems
Understand the system • Whether you’re trying to sort out a maintenance problem or are looking for energy savings, you need to understand how the equipment works. • Just by listening to the accounts of everyone with an interest in the equipment, you can soon get very good clues as to what is going on. Don’t jump in and just try to fix the reported problem, find out about the whole related system.
Surplus energy is the root cause of many Maintenance problems Energy Used = 100kW x 24 hours = 2400kWh per day Useful Work done (assuming 60% efficiency) = 1140kWh. Where does the 960kWh go!? It is this surplus energy, ie energy that is doing nothing useful, that causes maintenance problems. Principally Direct heat, friction and their resultant effects. Equipment that is 100% efficient has no surplus energy for causing maintenance problems.
Getting it together - the benefits of integrating Maintenance and Energy savings • Integrate maintenance and energy management systems • Install energy saving measures during routine maintenance breakdowns • Capture all maintenance and energy savings when making proposals • Identify the energy costs of poor maintenance practices and unscheduled breakdowns
The Associated Benefits • Increases manufacturing system availability. • Reduces the risk of consequential damage. • Improves the manufactured product quality & waste. • Improves safety characteristics • Improves plant performance • Contributes to more effective equipment design. • Minimises capital expenditure by achieving the cost effective procurement of equipment.
CM Programme Considerations • Site Audit – Criticality Assessment • Selection of Appropriate Techniques • Database Configuration • Periodic Data Collection • Analysis & Reporting • Continuous Improvements • Programme Justification
Monitoring Asset Condition • Visual Inspection • Vibration Monitoring • Thermal Imaging • Oil Sampling and Analysis • Ultrasonic Leak Detection • Motor Current Analysis
Level I - Vibration Magnitude Simple Vibration Meter vibration level hi alarm hi alarm lo alarm lo alarm
Level II - Vibration Analysis Data Collector/ Analyser vibration frequency time waveform
Frequency Level II - Vibration Analysis Amplitude Balance Alignment Bearing Gears
Vibration Monitoring • Imbalance • Alignment • Bearing / Gearbox Defects • Lubrication Quality & Deficiency • Machine and Structural Resonance
Oil Analysis Fluid Properties The condition of chemical And fluid properties Contaminants Presence of fluid and surface destructive contaminants Wear Debris Analysis Presence of machine wear materials