Quartiles + Box and Whisker Plots
110 likes | 261 Vues
Quartiles + Box and Whisker Plots. Quartiles. Step 1: Find the Median. This is called Q2, or the second quartile. Step 2: Split the first half into 2 equal groups (same rules as finding the median). The middle value is called Q1, or the first quartile.

Quartiles + Box and Whisker Plots
E N D
Presentation Transcript
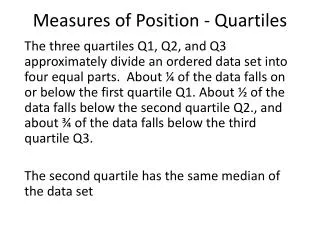
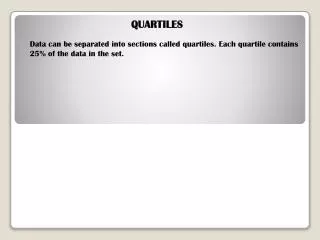
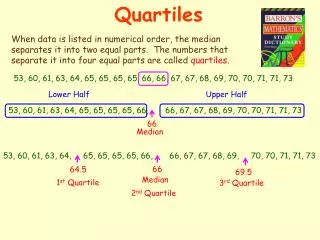
Quartiles • Step 1: Find the Median. This is called Q2, or the second quartile. • Step 2: Split the first half into 2 equal groups (same rules as finding the median). The middle value is called Q1, or the first quartile. • Step 3: Find median of top half of numbers (Q3). • You have split the numbers into 4 quarters.
12, 15, 18, 24, 26, 29, 30, 32 Q2 = average of 24 and 26 Q2 = 25
12, 15, 18, 24, 26, 29, 30, 32 Q2 = 25 Q1 = 16.5 Q3 = 29.5
Box and Whisker Plot • 1) Draw a number line from the lowest to highest value • 2) Draw a line above Q1, Q2 and Q3 10 12 14 16 18 20 22 24 26 28 30 32
Box and Whisker Plot • 2)Draw a line above Q1, Q2 and Q3 • 3) Attach lines to make the “box” 10 12 14 16 18 20 22 24 26 28 30 32
Box and Whisker Plot • 2) Draw a line above Q1, Q2 and Q3 • 3) Attach lines to make the “box” 10 12 14 16 18 20 22 24 26 28 30 32
Box and Whisker Plot • 4) Draw a line over the minimum and maximum values • 5) Draw “whiskers” 10 12 14 16 18 20 22 24 26 28 30 32
Example • 6, 8, 12, 14, 17, 19, 21, 24, 25 Q2 Q1 = 10 Q3 = 22.5
Measures of Dispersion • Variation Interval: [Xmin , Xmax] 100% of data in this interval • Range: Xmax – Xmin • Interquartile Interval: [Q1, Q3] 50% of data in this interval • Interquartile Range: Q3 – Q1