Quartiles
Quartiles. When data is listed in numerical order, the median separates it into two equal parts. The numbers that separate it into four equal parts are called quartiles. 53, 60, 61, 63, 64, 65, 65, 65, 65, 66, 66, 67, 67, 68, 69, 70, 70, 71, 71, 73. Lower Half. Upper Half.

Quartiles
E N D
Presentation Transcript
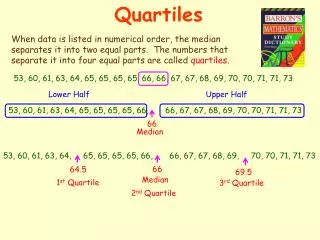
Quartiles When data is listed in numerical order, the median separates it into two equal parts. The numbers that separate it into four equal parts are called quartiles. 53, 60, 61, 63, 64, 65, 65, 65, 65, 66, 66, 67, 67, 68, 69, 70, 70, 71, 71, 73 Lower Half Upper Half 53, 60, 61, 63, 64, 65, 65, 65, 65, 66, 66, 67, 67, 68, 69, 70, 70, 71, 71, 73 66 Median 53, 60, 61, 63, 64, 65, 65, 65, 65, 66, 66, 67, 67, 68, 69, 70, 70, 71, 71, 73 66 64.5 69.5 Median 1st Quartile 3rd Quartile 2nd Quartile
Using the Calculator to Find Quartiles 53, 60, 61, 63, 64, 65, 65, 65, 65, 66, 66, 67, 67, 68, 69, 70, 70, 71, 71, 73 Store the data Analyze the data Minimum Value = 53 1st Quartile = 64.5 Median = 66 3rd Quartile = 69.5 Maximum Value = 73
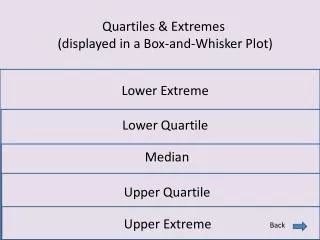
Box-and-Whisker Plot 53, 60, 61, 63, 64, 65, 65, 65, 65, 66, 66, 67, 67, 68, 69, 70, 70, 71, 71, 73 53, 60, 61, 63, 64, 65, 65, 65, 65, 66, 66, 67, 67, 68, 69, 70, 70, 71, 71, 73 69.5 64.5 66 53 73 Max Value Min Value 3rd Quartile 1st Quartile Median These five numbers are the statistical summary of the data. Draw a scale with numbers from the minimum value to the maximum value. Place dots above the scale to represent the five numbers that are the statistical summary of the data. Draw a box around the dots that represent the 1st & 3rd quartiles. Draw a vertical line through the dot representing the median. Connect the minimum value and the maximum value to the box with whiskers. 50 55 60 65 70 75